📅April 22nd, 2023
Do you remember DirectDraw? The DirectX 5 SDK disc came with a bunch of samples, including one called "Wormhole".
Looks like this:
How it works: despite how the image looks animated, there's no change to the framebuffer data. It's all palette rotation. The sample comes with a bitmap specially chosen so that the colors rotate to produce this 'wormhole' animation.
If you want to try it yourself, load it up from a DirectX 5 SDK disc (it's on some other SDK version discs, as well). Or, you can find it on the Internet Archive here: https://archive.org/details/idx5sdk.
My project: ported this sample to C256 Foenix. (Update: I later also ported it to F256 Foenix.)
This is a language (C to 65816) and platform (Win32+DirectDraw to C256 Foenix + Vicky II) port.
Some of the challenges were:
- Making sure the right bitmap with the right palette gets initialized. See, it's not sufficient to simply read RGB of the original bitmap and emit a new one that looks visually equivalent. The original bitmap's palette needs to be preserved. It contains "dead" colors- colors that aren't referenced by any one pixel as you view it, but are important to the rotation effect. I wrote a tool called BitmapEmbedder to take care of this.
- Betting on how long, in terms of clock, the rotation effect would take to execute. I was bold and put it all in VBLANK handler. Fortunately it fit and I didn't optimize for perf super aggressively. I had no idea whether it would fit. If it didn't, I would've to pull a bunch of it out and synchronize it. And it would be easier to do that at the beginning, before it's all set up. I took the risk at the beginning that it would fit and this paid off.
- Having a loop that needed to be longer than the signed branch distance limit. I could have maybe added a "hop" to get back to the beginning of the loop. Instead I factored out a function for no reason other than to get past the limit. It doesn't make me feel great. Could be something to revisit later.
A bunch of other things worked well. Vicky II has a dedicated bitmap layer that you can cleanly copy to. I say cleanly because it was a lot easier to work with compared to Apple II, and SNES for that matter. There isn't any weird swizzling, interleaving or holes. It was exactly compatible with a DirectDraw surface in terms of indexed color and surface size.
Result looks like: (comparison between the original and the port)
If you aren't familiar with the concept of palette rotation:
Palette rotation is a visual effect made possible by storing image data in a compact way.
You might be familiar with not-very-compact ways to store image data. For each pixel, say, you store a red, green and blue color value. Functionally that works, no worries. But the memory cost- even if each color channel is only two-thirds of a byte, then each pixel will still take up two bytes. Or if each color channel is a byte, you're looking at three bytes then. Or even four if you use alpha. The memory cost can really add up to more than you can afford.
There's a more compact way to store image data. You can store indexed color instead. For each pixel, store a key. The key is only 1 byte, not 4. It's a number from 0 to 255. When the computer displays the image on the screen, it will use that key to look up into a palette, or table of colors. In a way, this limits image quality, since you can only have an image with a low total number of colors (256). But you save a lot of memory. After all, each pixel takes up only one byte.
There are different configurations of key size affecting how many colors you can use at a time. You could sacrifice image quality to optimize for memory even more. Like anything there are tradeoffs. Having a key be one byte is a popular choice though, and this is supported on Vicky II.
Ordinarily, it'd cost a lot of perf to implement palette lookups yourself in your software. "For each pixel, look up into the palette, assign a color..." It's be so slow. Fortunately, indexed color is an industry-recognized idea that has built-in hardware acceleration on a ton of platforms, including on Vicky II. That's where the benefit really shines, so you don't have to worry.
Anyway, as you see with indexed color, there's indirection. Change one entry in the palette, a simple one-byte change, and it could affect half your image or more. Because of the indirection used with indexed color, an effective way to animate things can be to not animate the image data at all, but to simply make a small change to the palette. The palette has way fewer bytes of data, yet the capacity to change how the whole image looks.
Palette rotation can also be called color cycling. There are some beautiful artworks using color cycling to convey water, snow, or other effects. For example, see this snow effect from this demo page (not my page):
The grid in the lower right shows the palette being changed.
Or this one, with rain:
The Wormhole sample uses the idea of palette rotation to achieve an animation effect. It only copies the original bitmap data once on application start. It never touches it again.
Every VBLANK handler, it only updates the palette. And although it does a lot of manipulations to the palette-- there's four loops, iterating over various parts of it, copying entries around-- it can still be way less expensive than an alternative way of animating things- iterating over every pixel in the bitmap. This way, you can exploit this compactness in the image format to get a performance benefit too.
Source code available here:
https://github.com/clandrew/wormhole/blob/main/vickyii/wormhole.s
📅December 15th, 2022
Consider this 65816 program
.cpu "65816"

PUTS = $00101C
PUTC = $001018
* = $00FFFC
RESET   .word <>START

* = $002000
START   CLC                         ; Make sure we're native mode
        XCE

        REP #$30
        .al
        .xl
        JSR MSG1

        SEP #$30  ; Set 8bit axy
DIV

;;;;;;;;;;;;;;;;;;;;;;;;;;;;;;;;;;;;;;;;;;;;;;;;;;;;;;;;;;;;;
; Value      ; 8bit interpretation    ; 16bit interpretation
;;;;;;;;;;;;;;;;;;;;;;;;;;;;;;;;;;;;;;;;;;;;;;;;;;;;;;;;;;;;;
;            ;                        ;
.byte $A9    ; LDA #$3A               ; LDA #$3A3A
.byte $3A    ;                        ;
.byte $3A    ; DEC A                  ;
;            ;                        ;
.byte $29    ; AND #$39               ; AND #$3A39
.byte $39    ;                        ;
;            ;                        ;
.byte $3A    ; DEC A                  ;
;            ;                        ;
.byte $29    ; AND #$38               ; AND #$2038
.byte $38    ;                        ;
;            ;                        ;
.byte $20    ; JSR $20EA              ;
.byte $EA    ;                        ; NOP
;            ;                        ;
.byte $20    ;                        ; JSR $20E0
;            ;                        ;
.byte $E0    ;
.byte $20    ;

        TAX
        JSR CLRB
        JSL PUTS
        JSR MSG2

DONE    NOP         ; Spin
        BRA DONE

* = $002038
MODE16 .null "16"
PRE   .null "This is in "
SUF   .null "-bit mode.     "

CLRB    LDA #$0000
        PHA
        PLB
        PLB
        RTS

MSG1    JSR CLRB
        LDX #<>PRE
        JSL PUTS
        RTS

MSG2    JSR CLRB
        LDX #<>SUF
        JSL PUTS
        RTS

* = $0020E0
        RTS

* = $0020EA
        JSL PUTC
        REP #$30
        .al
        .xl
        JSR MSG2
        JSR MSG1
        JMP DIV
for C256 Foenix, assembled with 64tass.
When run, the output looks like
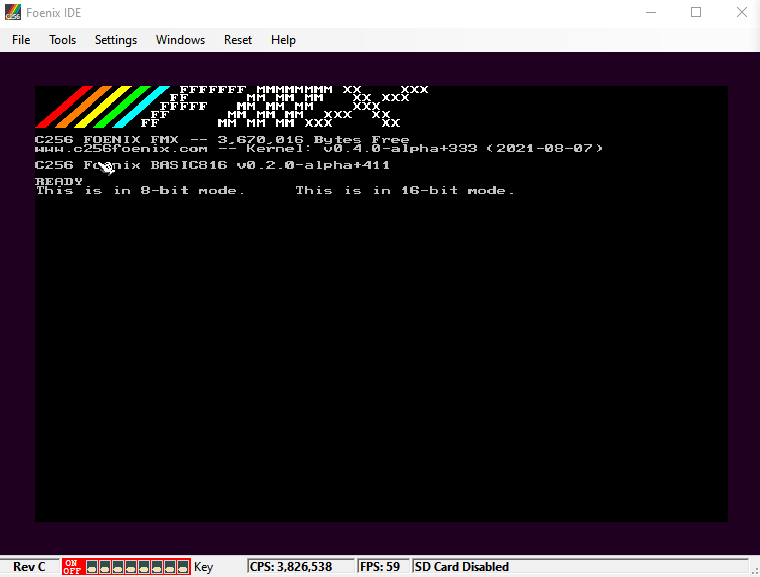
Explanation: the part of the program labeled 'DIV' will run twice, under different interpretations. First in 8bit mode, then in 16bit mode, for displaying the '8' and '16' printable characters respectively.
Normally code in 8bit is garbage when interpreted in 16bit mode and vice-versa. These ops were specially chosen so that they are valid in both with different behavior
Because it's not possible to express the reinterpretation idea in an assembly language, this just dumps the code bytes in the middle of the program and there's 2 columns of commented-out language explaining what the bytes do. The 2 columns are one for 8bit and one for 16bit.
I wrote it as a silly test. It's a test for the debugger. It's to see how it might display in a 'source-style' debugger. When running it I pass the debugger my source file listing.
It goes... not great
'Transcript debugging' described in this earlier post fixes it, it's 100% coherent and matches the source.
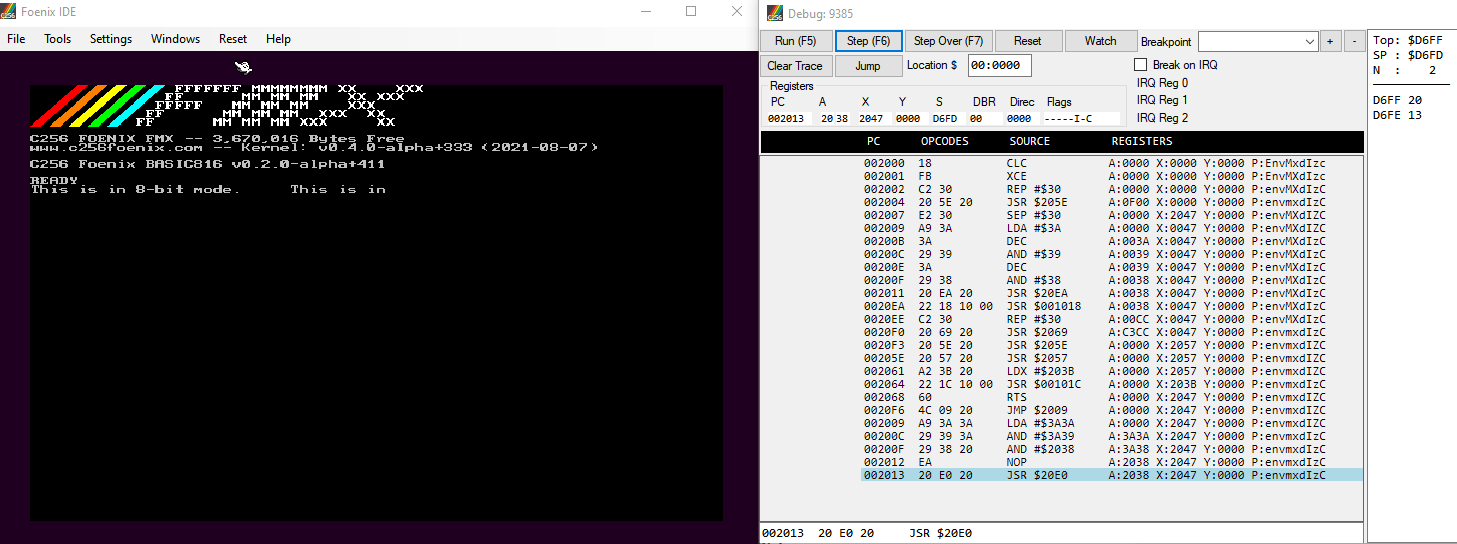
So a good vote to use that kind of debugger for this type of thing.
Full source code available here:
📅December 14th, 2022
Summary: I'm making a case for a certain type of debugger.
More detail below.
A couple times people trying to get into ROM patching ask me what tool I use. I'll answer, although it's not the popular answer. It takes some getting used to because of type of debugging it is and for other reasons.
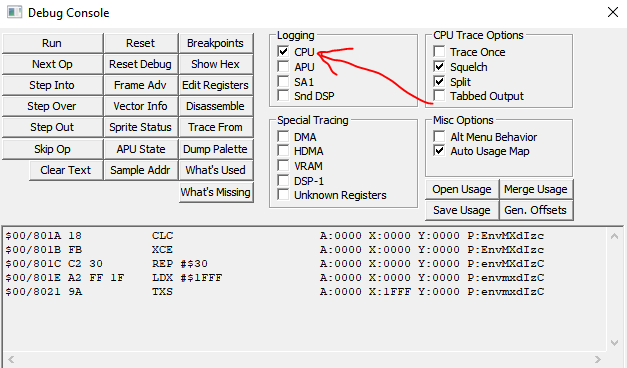
What I use for most of my patching stuff is Geiger's SNES debugger. It's a special build of Snes9x with a debugger bolted on.
Looks like this
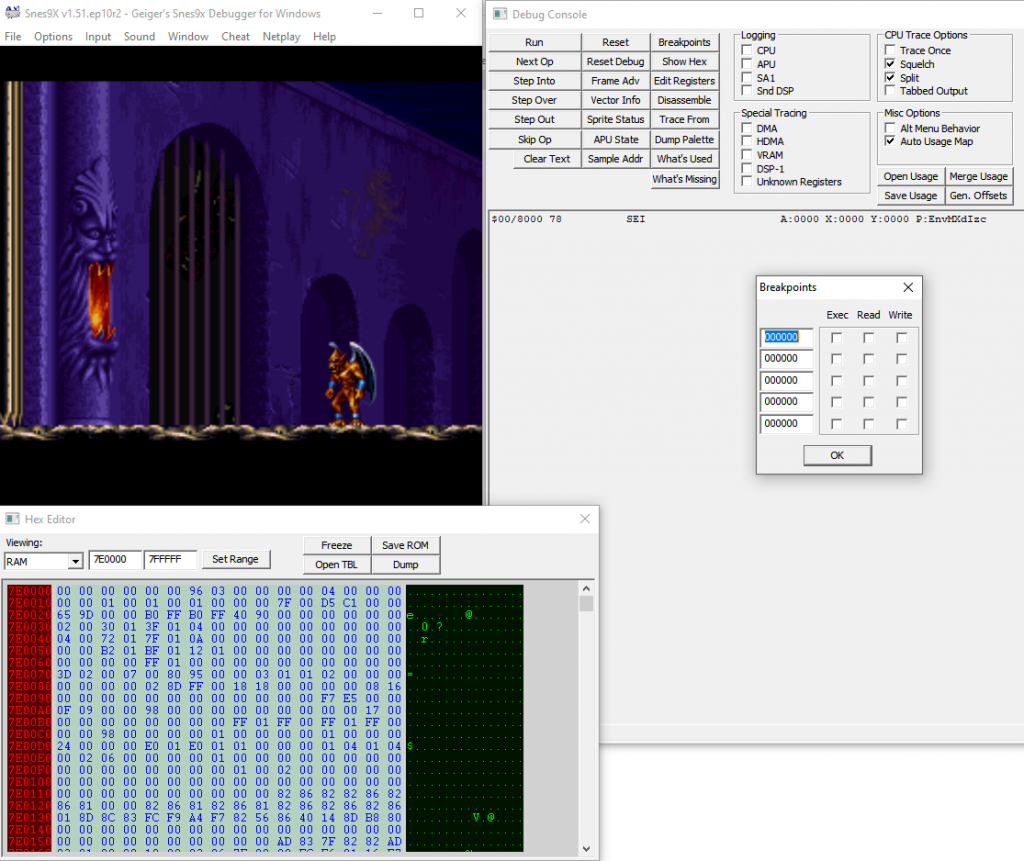
The game, main debugger interface, and memory view are in different windows. You press the 'Breakpoints' button to get a pop-up dialog for setting those. Looks very Win32 ish.
Why not for everyone?
When I first started looking into debugging SNES it was a while ago, this was one of the best options available.
Since then, the world has moved on.
Despite the age of the SNES today, there is a lot of information out there sourced by fans and tools under active development.
Today, there are SNES debuggers that
- have larger feature sets
- have been tested more thoroughly to weed out issues
- have interfaces that suit newer UI/UX paradigms
- are actively developed
- are open-source and so are easy to extend
The debugger has some 'personality traits' I've gotten used to working around. Here's a list of what they are in case you run into them.
Issue: Breakpoints don't hit after certain operations (e.g., save state load)
Workaround: Re-open the breakpoint window, and click OK.
Issue: Step Out doesn't step out to the expected place
Workaround: Don't rely on Step Out for function calls that straddle any interrupts.
Issue: 'Show Hex' (memory) window shows blank ROM on 1st open
Workaround: Choose something (e.g., RAM) 'viewing' dropdown then go back to ROM.
Issue: Emulator crash if you scroll too far down in the memory window
Workaround: Don't use invalid ranges. Don't try to scroll past the end of the range.
Issue: Can not view CGRAM or OAM
Workaround: Use a different debugger.
Issue: Can not view DBR or PBR
Workaround: Edit some code to push them (PHB/PHK) then PLA.
Software
The debugger isn't under active development anymore so things like the above list are what they are. I contacted Geiger asking for the source code. He responded wishing me well, and wouldn't give it to me for various reasons which is his perogative.
None of these were bad enough to block me, it's been alright.
They also weren't severe enough to be motivating to go in and fix them in this closed-source program.
Why I use it
Despite the above things, I still use it for a few reasons.
- Habit. I know my way around it
- The most complicated parts of what I need to do aren't actually through a debugger, (e.g., 'special diffing' of memory dumps), and a debugger could never do as good a job as flexible-function code.
- Transcript-style debugging.
The biggest one is transcript debugging.
For transcript-style debugging see explanation below.
Transcript-style debugging
For ROM patching projects where the patch is a small targeted surface area, generally speaking you're not trying to recover source code.
Recovering source code so that you can work in it is something you can do if you really want. You can do it if it makes you happy. But it's not always crucial. It can even be a distraction. Be it in an assembly language or a higher-level language like C/C++, recovering source code can be unnecessary for your goal of a targeted change in behavior and can make the task way less efficient.
To get better at this kind of reverse-engineering task, and this is hard for a lot of people to hear-- you need to fall out of love with source code written in programming languages. This includes source-level debugging, it includes expressions of flow control, and this includes source code written in assembly languages.
Below is an example of a debugger listing not using source-level debugging, and using transcript-style debugging instead:
$80/BC3A 20 B0 C1    JSR $C1B0  [$80:C1B0]   A:0000 X:00A9 Y:0005 P:envmXdizc

$80/C1B0 64 6F       STZ $6F    [$00:006F]   A:0000 X:00A9 Y:0005 P:envmXdizc
$80/C1B2 A5 6C       LDA $6C    [$00:006C]   A:0000 X:00A9 Y:0005 P:envmXdizc
$80/C1B4 0A          ASL A                   A:3640 X:00A9 Y:0005 P:envmXdizc
$80/C1B5 88          DEY                     A:6C80 X:00A9 Y:0005 P:envmXdizc
$80/C1B6 F0 13       BEQ $13    [$C1CB]      A:6C80 X:00A9 Y:0004 P:envmXdizc
$80/C1B8 90 38       BCC $38    [$C1F2]      A:6C80 X:00A9 Y:0004 P:envmXdizc
$80/C1F2 86 00       STX $00    [$00:0000]   A:6C80 X:00A9 Y:0004 P:envmXdizc
$80/C1F4 A2 02       LDX #$02                A:6C80 X:00A9 Y:0004 P:envmXdizc
$80/C1F6 0A          ASL A                   A:6C80 X:0002 Y:0004 P:envmXdizc
$80/C1F7 88          DEY                     A:D900 X:0002 Y:0004 P:eNvmXdizc
$80/C1F8 F0 20       BEQ $20    [$C21A]      A:D900 X:0002 Y:0003 P:envmXdizc
$80/C1FA E8          INX                     A:D900 X:0002 Y:0003 P:envmXdizc
$80/C1FB 90 F9       BCC $F9    [$C1F6]      A:D900 X:0003 Y:0003 P:envmXdizc
$80/C1F6 0A          ASL A                   A:D900 X:0003 Y:0003 P:envmXdizc
$80/C1F7 88          DEY                     A:B200 X:0003 Y:0003 P:eNvmXdizC
$80/C1F8 F0 20       BEQ $20    [$C21A]      A:B200 X:0003 Y:0002 P:envmXdizC
"But isn't this source code in assembly language?" I heard this question before. I think this confusion comes from people who haven't done much forward engineering with assembly languages yet, forget reverse engineering.
The above is not source code, it's a debugger transcript.
Again, it's not source code, it's printout of what got executed, one instruction at a time.
Dead giveaways that it's not source code
- Every line starts with an address
- Every line ends with register state
- There's a function call and then the stepped-into body immediately after. Not proper for source code
- Some instructions are repeated, like $80/C1F6, $80/C1F7, $80/C1F8. This is a loop
Thinking it's source code is pretty uncharitable to the readability of source code, which usually uses more identifiers and comments and labels and stuff than this example has.
The transcript looks different from source code, and transcript debugging is different from source style debugging.
How is transcript debugging different?
Now that we know what transcripts are: transcript-style debugging is different from source-style, or traditional debugging.
See an example of source-style debugging, with No$sns:
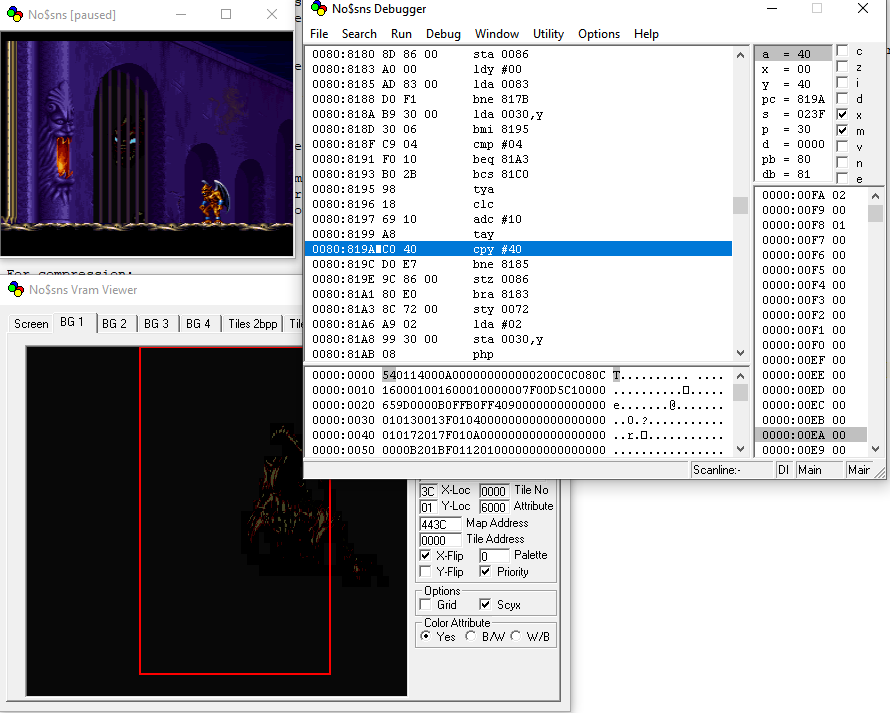
There's a window. In the window, the local disassembly appears in a listing, with the current instruction highlighted in blue. The local disassembly shows instructions laid out in one contiguous block of memory.
Or, here's another debugger, bsnes:
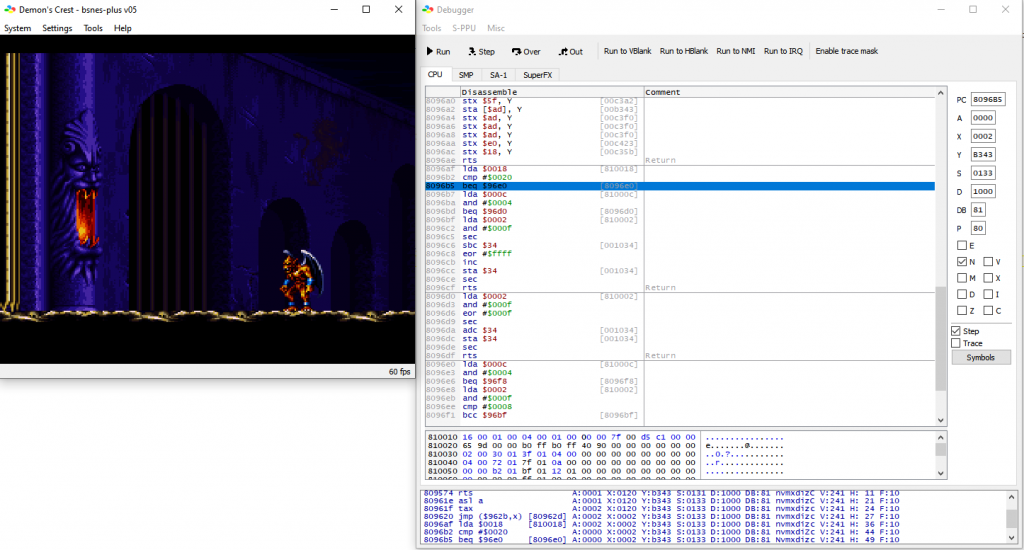
Another example of source-style debugging. The disassembly listing is on the right, with the current instruction highlighted in blue. They go the extra mile and put dividing lines in at observed function boundaries. I don't think that can ever be 100% robust but it's nice regardless.
Or, here's Visual Studio 2019:
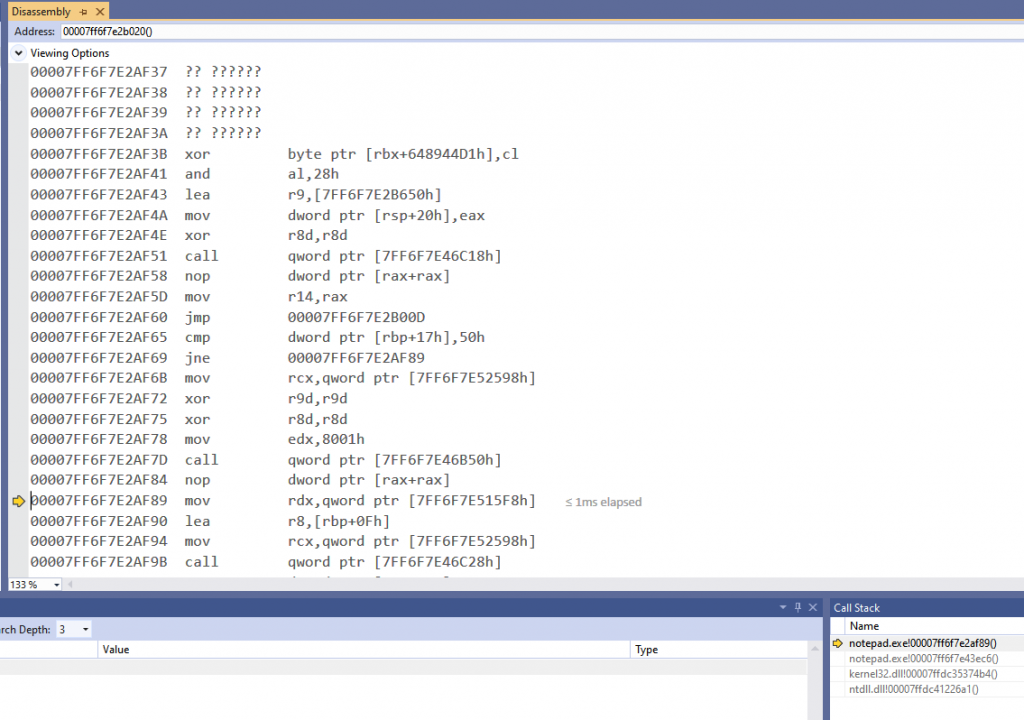
The instructions are listed out. The current instruction is highlighted with a yellow arrow to the left of it. There's some things that couldn't be disassembled so there's a placeholder with question marks.
These are all examples of source-style debugging. It's very popular.
Depending on the implementation, the listing in a source-style debugger can either be
- a local disassembly where all surrounding memory gets interpreted as code, whether it actually is code or not, or
- the result of a tracing, where only executed instructions appear in the listing, creating gaps
The former is a lot more common, as in all the above examples, although I've seen both.
By contrast, a transcript style debugger will look like this:
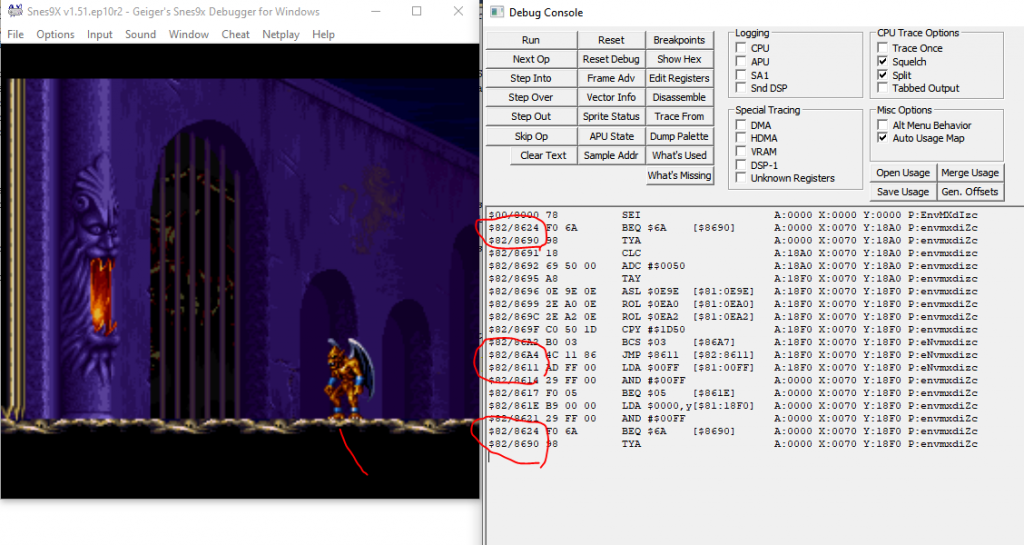
See, there are disjoint instructions, with those pairs circled in red.
Some instructions are listed more than once.
And register state is shown on each line. This platform doesn't have a ton of register space so that's honestly pretty manageable.
The transcript shows all branches with the branch taken, all registers with state at the time, all opcodes with their resolved argument, all loops are unrolled.
The kicker is that implementation of this debugger is dead simple and actually very dumb. It echoes each executed instruction to the output, along with the current register state. That's it.
Yet it is powerful and offers some advantages.
Advantage: history of register values
It's true pretty much all debuggers will show you register values, or variable/memory values at the current instruction. But what about 5 or 10 instructions ago?
You need to either have time-travel debugging, log it, or restart your program.
Some debuggers will cache the "last seen" way something executed (pointer argument, etc), and update it when that instruction is executed again. Great, you can see what was the last way something executed.
But what about the time before that? Or earlier? You can't easily put together a history of what happened unless you log these data points manually yourself.
For reverse-engineering object code with no source code, getting this history is really important in figuring out what happened. You might need to look for trends, look for a pattern, to get a sense of the higher level algorithm. Or you might want transcripts even with code you are familiar with, to get something like a time-travel trace on platforms where actual time-travel isn't available. There's strictly more information in the transcript than in the source-style listing.
"But, it's only outputting registers each line, not all of memory each line". That's true. Each line of the transcript is not a complete state of the machine. I think register state is the right tradeoff to suit most tasks. The exact choice will depend on the platform and the situation. If you're blessed with extensible transcript debugging, that'd probably be the best thing, so you could have like a "watch window" for each line. Generally for SNES, A/X/Y/P is perfectly fine.
Advantage: history of flow control
You can see a clear history of flow control. After all, that's useful. With a couple source-style debuggers, I've seen them do crazy things like try and draw a cute arrow denoting a function was stepped into.
With a transcript, you can see a history of how many times a loop ran, what index of a jump table was used, and which branches had the branch taken. If you save longer transcripts (e.g., with Geiger's SNES debugger's CPU log feature) you can also meaningfully diff transcripts with any text diffing tool of your choice to find divergent control flow like this.
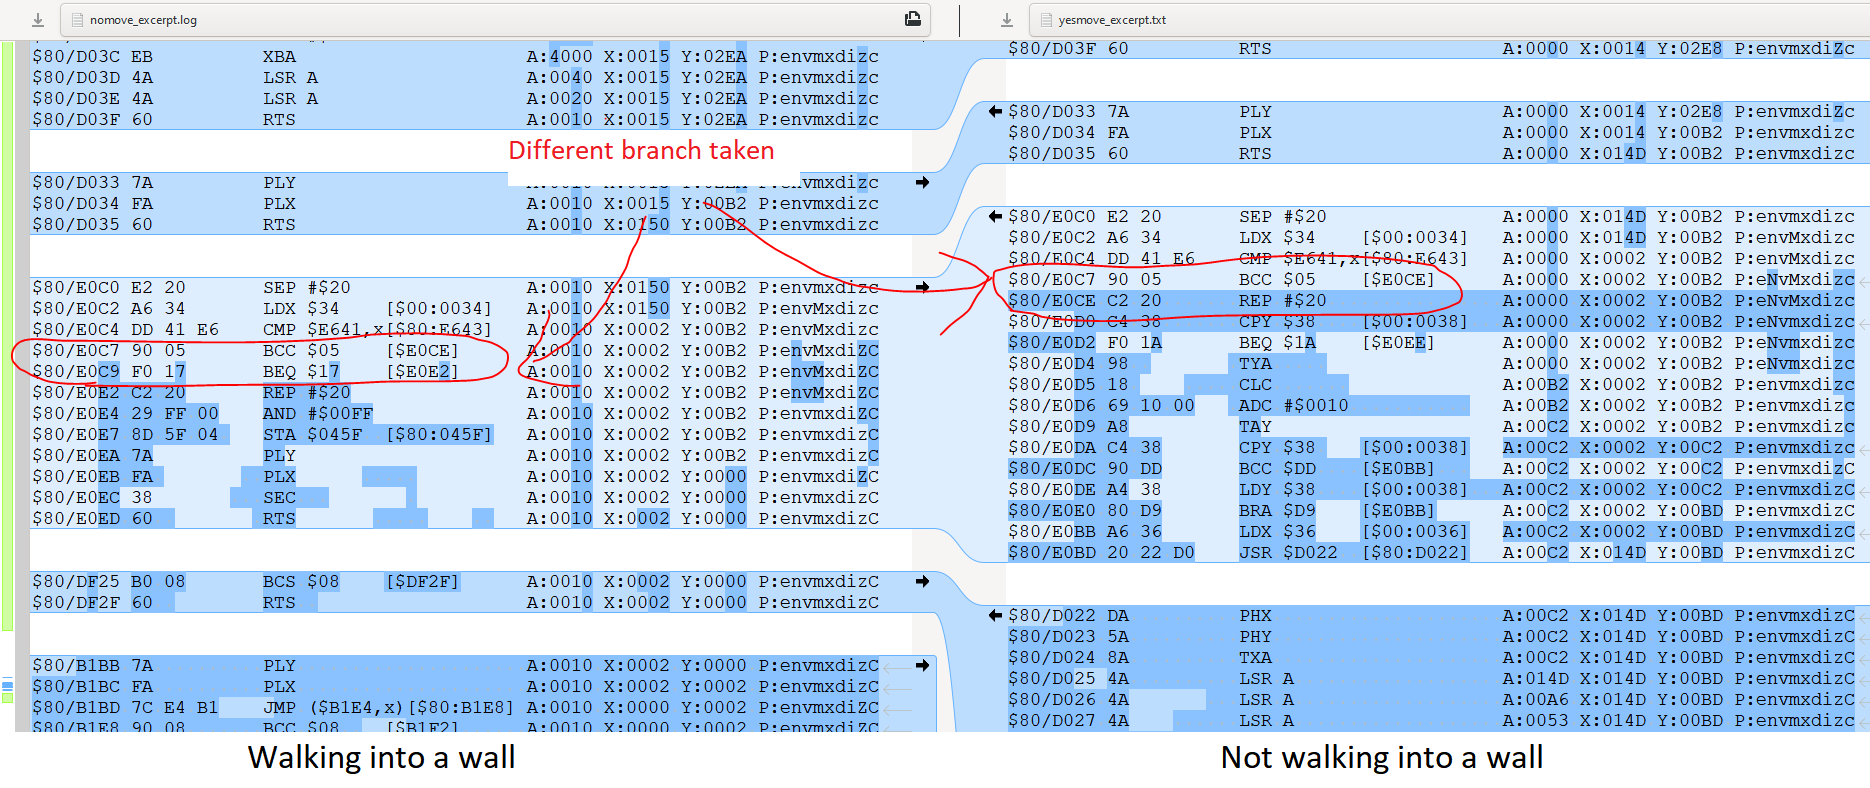
With source-style debugging, you have no record-keeping of this unless you log it yourself, and you can easily miss what you're looking for.
Advantage: An edge case
This is a bad scenario and not something I've ever seen happen out in the wild.
But you could have it where the same memory is executed twice with the code interpreted in different ways, e.g., 8 bit versus 16 bit native mode.
I don't think a source style debugger could easily make sense of this. A transcript would show what happened clearly.
I made a proof of concept that does this and on testing it doesn't work well at all in a source-style debugger.
Advantage: Don't disassemble stuff that's not code
This is a big one, SNES games will often litter non-code throughout code.
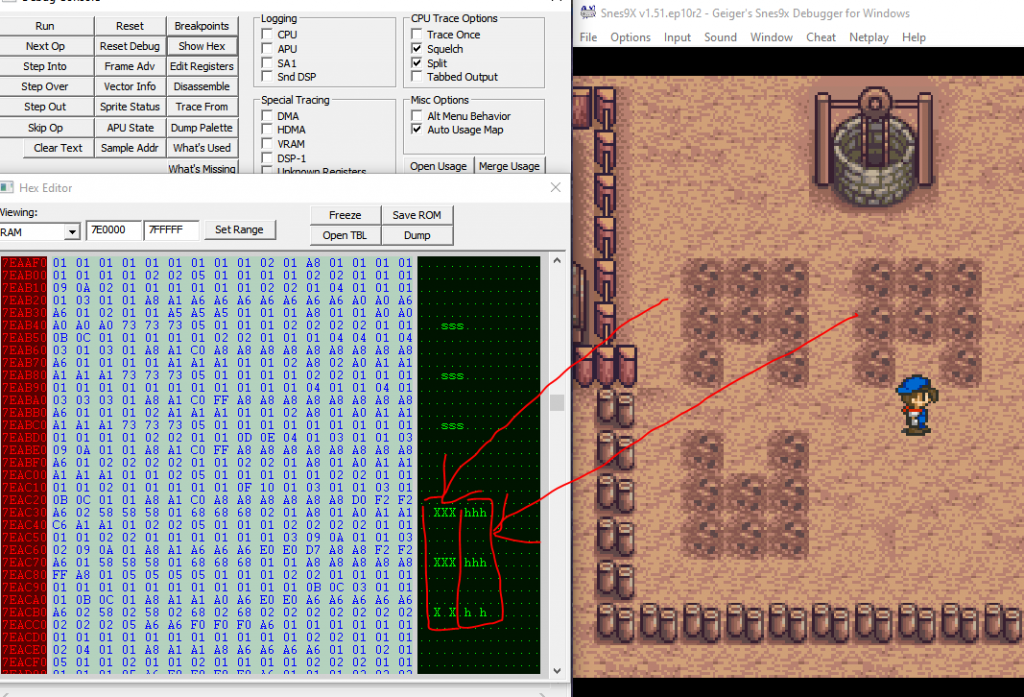
For example of what I mean, consider the game NHL '94 for Super Nintendo, This is bsnes broken in NHL '94's graphics decompression
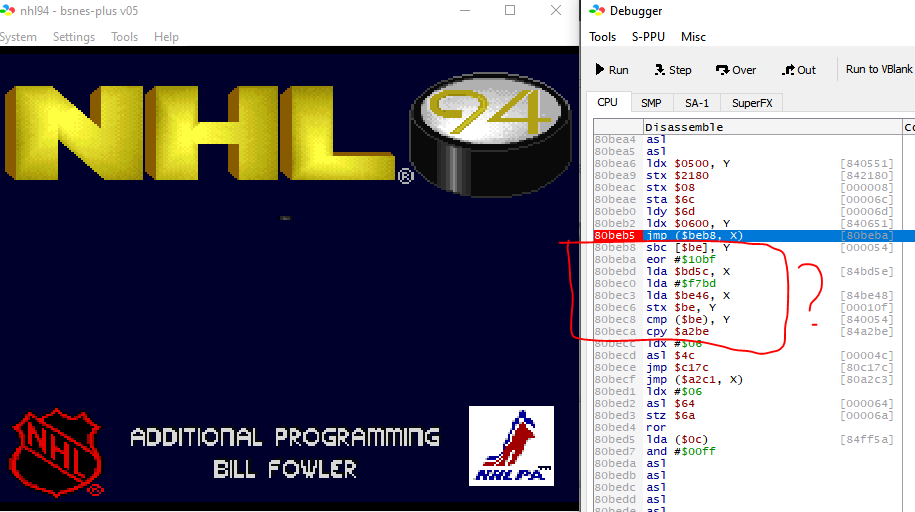
See the part outlined in red. Although there's no obviously illegal instructions, it looks suspicious. Why the CPY with such an arbitrary magic number address? Same with the EOR and the literal, what's up with that? Why the LDAs that immediately get overwritten?
The answer is this isn't code at all. It's data. This source-style debugger will disassemble everything in the neighborhood. That works great only so long as it actually is code. You hope it looks like obvious garbage code, so you can quickly spot it.
In this case, it's actually an array of short pointer offsets baked into the middle of object code. Those are supposed to be offsets, not instructions. If you're really observant you'll see that the preceding JMP $BEB8, X indexes into it and jumps based on an element. It's a hassle to spot this right away, and the debugger isn't doing anything to help you.
Here's another example in a different place
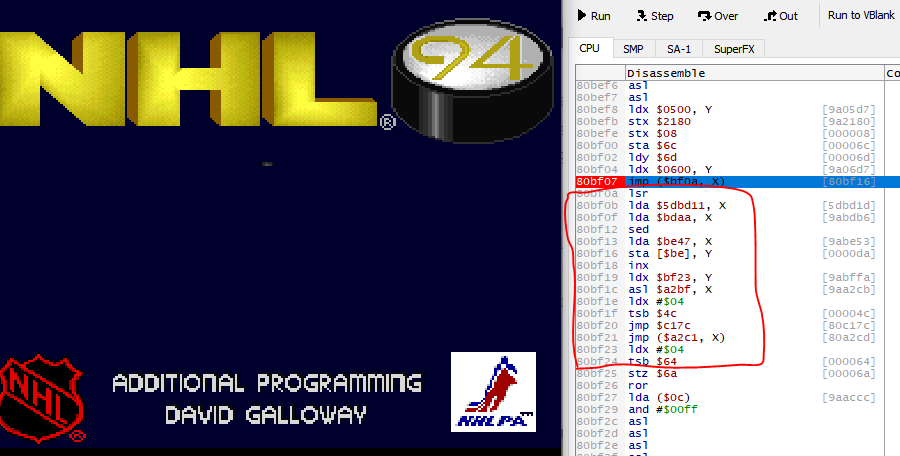
Again red outlined part is not actually code, it's data. This one's sneakier than the above because from a glance it looks less garbage compared to the last one. The big giveaway is SED which is not commonly used.
With transcripts, we don't have this problem. These garbage instructions aren't something you have to discern from non-garbage. Why? Because they don't get executed. They don't even appear.
Why is there data beside the code?
SNES is a different kind of execution environment from what some people are used to.
For the situation above, you might have the reaction "But I work in x86 a lot and I've never seen this before."
Well, x86-64 applications won't have data sprinkled in the code.
Why? Because Intel's architecture does really aggressive instruction prefetching, and the CPU has to know what's code versus what's data for that to work.
You can hear it from Intel themselves:
If (hopefully read-only) data must occur on the same page as code, avoid placing it immediately after an indirect jump. For example, follow an indirect jump with its mostly likely target, and place the data after an unconditional branch.
[...]
Always put code and data on separate pages.
Source: Intel's Optimization Guide
If you write source code that is compiled, at least for a Windows executable, the compiler will put object code in the .text segment and constant data in the .rodata segment- it'll do that for you.
Or if you write source code in x86 assembly language, generally you'd would use a directive like .CODE or .DATA to explicitly define what goes where. The details depend on which assembler you use and what exactly is it outputting.
The WDC 65xx-based CPU, on the other hand, is out there living its best life. Memory is just memory, doesn't matter what's where.
Since it doesn't matter at all, it's up to developer preference and convenience. In practice I do notice developers for 65xx platform dump data in the middle of their code like all the time. They'll bake data local in the same bank to take advantage of direct addressing, since if you put all data together it'd have to go in a different bank to fit. Or they're trying to save a MMU page change on certain computers where that matters (e.g., Foenix F256). Or they'll use a self-modified jump instruction instead of a jump table.
So if you work mostly in x86-64 or any other compiler toolchain with the same recommendation, that's one more reason why you probably go through life dealing with source style debuggers. No surprise data tripping you up. It's probably not something you ever think about.
With reverse-engineering on a platform like SNES the value of transcripts is more clear.
Recommendation
Geiger's SNES debugger is a transcript-style debugger, and you should consider it or something similar if you are debugging SNES without source code.
I also think transcript-style debugging is something we as an industry should consider more for debugging object code without source code. The benefit of source-style assembly debugging really only shines when you have symbolic debugging, or corresponding source code.
Using transcripts liberates you where you're not burdened with mapping control flows back to source code, there is only a series of behaviors. You could map them back to code, eventually. It's just not where you start.
Practical justification: I used transcripts to get these done
- Ripping all maps of Lagoon
- Enlarging the hitboxes in Lagoon
- Making an NHL '94 player name, profile and stats editor
- Making an NHL '94 player graphics decompression tool that's 100% accurate to the game's
- Fixed a bug in Lord of the Rings
- Disabling collisions in Lord of the Rings
- Make plants in Harvest Moon be automatically watered
Bonus: Adding transcripts to C256 Foenix IDE debugger
C256 Foenix is a modern WDC 65816-based computer with an emulator.
For personal convenience I added transcript-style debugging to it, looks like this:
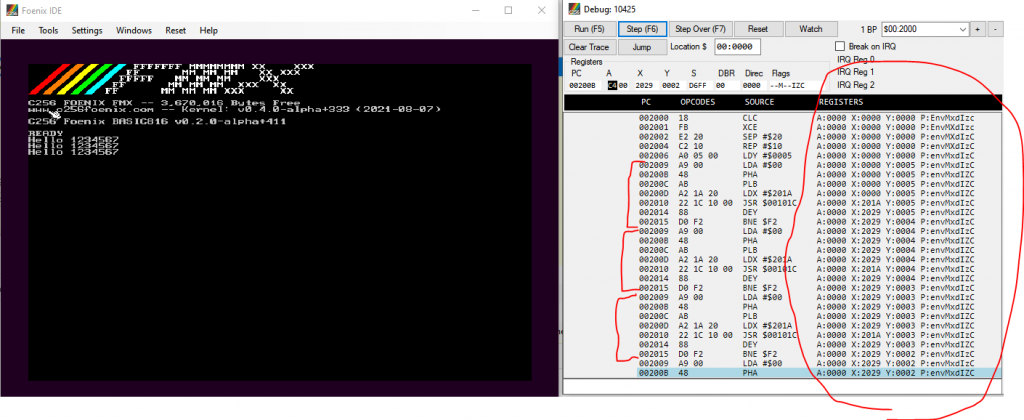
See there's duplicated instructions for a loop, and register output. With source-style, the listing looks like this, which provides a lot less information:
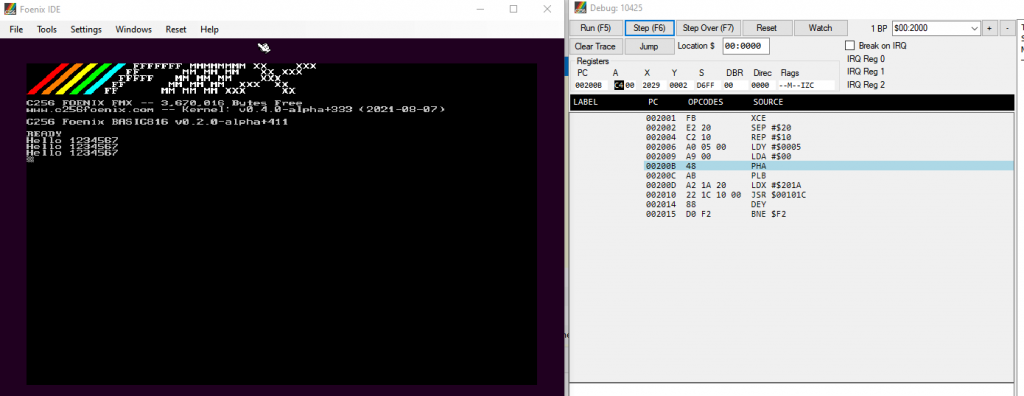
This transcript support is kept side-by-side with the default source-style debugger so that you can switch between them.
Enable it by going to "Settings" and checking the box for "Transcript-style debugger". When the box isn't checked, you get the default source-style debugger. The checkbox setting is remembered like the other settings so you don't need to check it every time.
I've already got some good use out of it. If you want to try it out, it's pushed to this private fork:
https://github.com/clandrew/FoenixIDE/tree/transcript
This change was not accepted for main because it seems like no one else uses this type of debugger, but the private fork is there for my purposes and if you want to use it too.
📅February 19th, 2022
To make it so you don't need to water your plants in Harvest Moon for Super Nintendo, use the PAR codes
82A8ACEA
82A8ADEA
Explanation below.
The game 'Harvest Moon' for Super Nintendo has fun elements, but also repetitive ones. One of them that wore on me was having to water your plants. If you water at night, it's not even a skill-based action mechanic since you can restore your energy and night lasts forever. I wanted to experience the game and see its content, but not have the repetitive action of watering.
Idea: patch the game so that watering is not needed
First approach was to take memory dumps before and after watering a tile, and diff them. Seems ok. But, the diffs were too noisy and I didn't know what I was looking for. How were the farm tiles stored? Was it even one byte per tile, one byte per pair of tiles, or something else entirely? I didn't even know that part yet, so I gave up on it.
Instead, I tried something way dumber- keep watering a tile with a view of live memory open, and watch for changes. I had an idea of what the storage could be- one byte per tile, arranged sequentially, so I looked for that. And I planted some test plants in an observable pattern. This plus exploiting timing of changes made it way easier to discern signal from noise and I found it.
There were not one, but two places the tile data lived. For the tile I'm standing near, the first was at 7E1100 and that one I found first. When I left the farm and came back I saw that the data got wiped and restored, so that meant it's a cache and not the primary copy.
Looking for a dupe of it in memory, I found that at 7EAC30, more likely to be the primary copy.
From experimenting I found this out about the tile storage:
- It is one byte per tile
- Tiles are stored sequentially. Nothing too crazy.
And as for what tile value means what thing, I found
| Tile Value | What It Means |
| 0x00 | Untilled, unwatered ground |
| 0x01 | Untilled, unwatered ground (different graphic from above) |
| 0x07 | Tilled, unwatered ground |
| 0x08 | Tilled, watered ground |
| 0x58 | Unwatered potato seed |
| 0x59 | Watered potato seed |
| 0x68 | Unwatered turnip seed |
| 0x69 | Watered turnip seed |
(Not exhaustive.)
From the data points there are, watering a tile simply increments its value by 1. So when it rains, something must iterate through all the tiles and increment their value by 1.
To find out what that is, I set a break-on-write of 0x7EAC32, the location of the top-left plant, looking for the value to change from 0x58 to 0x59. This took me right into this code
(Paste below is multiple debugging transcripts spliced together so don't put too much stock in the reg values.)
void ProcessWeather()
...
$82/8390 8F 1E 1F 7F STA $7F1F1E[$7F:1F1E]   A:0400 X:0400 Y:0400 P:eNvMxdizc
$82/8394 22 D6 89 82 JSL $8289D6[$82:89D6]   A:0400 X:0400 Y:0400 P:eNvMxdizc

// Call UpdateFarmTiles, transcribed below
$82/8398 22 11 A8 82 JSL $82A811[$82:A811]   A:0400 X:0400 Y:0400 P:eNvMxdizc

$82/839C 22 09 82 82 JSL $828209[$82:8209]   A:0400 X:0400 Y:0400 P:eNvMxdizc
...


void UpdateFarmTiles() - $82/A811
// Preconditions:
//    Weather is stored at $7E0196. 0x0 means sunny, 0x2 means rainy.
//    Farm data is stored around $7EAC30.
// This function is called when you sleep, no matter the weather or if you save.

$82/A811 E2 20       SEP #$20                A:0007 X:000E Y:0002 P:envmxdizC
$82/A813 C2 10       REP #$10                A:0007 X:000E Y:0002 P:envMxdizC
$82/A815 A9 04       LDA #$04                A:0007 X:000E Y:0002 P:envMxdizC
$82/A817 8D 81 01    STA $0181  [$00:0181]   A:0004 X:000E Y:0002 P:envMxdizC
$82/A81A C2 20       REP #$20                A:0004 X:000E Y:0002 P:envMxdizC
$82/A81C A0 00 00    LDY #$0000              A:0004 X:000E Y:0002 P:envmxdizC
$82/A81F A2 00 00    LDX #$0000              A:01E0 X:0400 Y:01E0 P:eNvmxdizc

StartProcessingTile:
$82/A822 5A          PHY                     A:00D0 X:00D0 Y:01D0 P:eNvmxdizc
$82/A823 DA          PHX                     A:00D0 X:00D0 Y:01D0 P:eNvmxdizc
$82/A824 86 82       STX $82    [$00:0082]   A:00D0 X:00D0 Y:01D0 P:eNvmxdizc
$82/A826 84 84       STY $84    [$00:0084]   A:00D0 X:00D0 Y:01D0 P:eNvmxdizc
$82/A828 20 3C B1    JSR $B13C  [$82:B13C]   A:00D0 X:00D0 Y:01D0 P:eNvmxdizc
$82/A82B E2 20       SEP #$20                A:074D X:074D Y:01D0 P:envmxdizc

// Load the state for a tile in your farm. We look at just 1 byte
$82/A82D BF E6 A4 7E LDA $7EA4E6,x[$7E:AC33] A:074D X:074D Y:01D0 P:envMxdizc

; Do various things for the different tile types.
$82/A831 D0 03       BNE $03    [$A836]      A:0758 X:074D Y:01D0 P:envMxdizc
$82/A836 C9 03       CMP #$03                A:0758 X:074D Y:01D0 P:envMxdizc
$82/A838 B0 03       BCS $03    [$A83D]      A:0758 X:074D Y:01D0 P:envMxdizC
$82/A83A 4C 1B A9    JMP $A91B  [$82:A91B]   A:0701 X:074F Y:01D0 P:eNvMxdizc
$82/A83D C9 A0       CMP #$A0                A:0758 X:074D Y:01D0 P:envMxdizC
$82/A83F 90 03       BCC $03    [$A844]      A:0758 X:074D Y:01D0 P:eNvMxdizc
$82/A844 C9 06       CMP #$06                A:0758 X:074D Y:01D0 P:eNvMxdizc
$82/A846 D0 03       BNE $03    [$A84B]      A:0758 X:074D Y:01D0 P:envMxdizC
$82/A84B C9 07       CMP #$07                A:0758 X:074D Y:01D0 P:envMxdizC ; Is tilled soil?
$82/A84D F0 55       BEQ $55    [$A8A4]      A:0758 X:074D Y:01D0 P:envMxdizC
$82/A84F C9 08       CMP #$08                A:0758 X:074D Y:01D0 P:envMxdizC
$82/A851 D0 03       BNE $03    [$A856]      A:0758 X:074D Y:01D0 P:envMxdizC
$82/A856 C9 1E       CMP #$1E                A:0758 X:074D Y:01D0 P:envMxdizC
$82/A858 F0 4A       BEQ $4A    [$A8A4]      A:0758 X:074D Y:01D0 P:envMxdizC
$82/A85A C9 1F       CMP #$1F                A:0758 X:074D Y:01D0 P:envMxdizC
$82/A85C D0 03       BNE $03    [$A861]      A:0758 X:074D Y:01D0 P:envMxdizC
$82/A861 C9 1D       CMP #$1D                A:0758 X:074D Y:01D0 P:envMxdizC
$82/A863 D0 03       BNE $03    [$A868]      A:0758 X:074D Y:01D0 P:envMxdizC
$82/A868 C9 20       CMP #$20                A:0758 X:074D Y:01D0 P:envMxdizC
$82/A86A B0 03       BCS $03    [$A86F]      A:0758 X:074D Y:01D0 P:envMxdizC
$82/A86F C9 39       CMP #$39                A:0758 X:074D Y:01D0 P:envMxdizC
$82/A871 D0 03       BNE $03    [$A876]      A:0758 X:074D Y:01D0 P:envMxdizC
$82/A876 C9 53       CMP #$53                A:0758 X:074D Y:01D0 P:envMxdizC
$82/A878 D0 03       BNE $03    [$A87D]      A:0758 X:074D Y:01D0 P:envMxdizC
$82/A87D C9 61       CMP #$61                A:0758 X:074D Y:01D0 P:envMxdizC
$82/A87F D0 03       BNE $03    [$A884]      A:0758 X:074D Y:01D0 P:eNvMxdizc
$82/A884 C9 6F       CMP #$6F                A:0758 X:074D Y:01D0 P:eNvMxdizc
$82/A886 D0 03       BNE $03    [$A88B]      A:0758 X:074D Y:01D0 P:eNvMxdizc
$82/A88B C9 79       CMP #$79                A:0758 X:074D Y:01D0 P:eNvMxdizc
$82/A88D D0 03       BNE $03    [$A892]      A:0758 X:074D Y:01D0 P:eNvMxdizc
$82/A892 C9 7C       CMP #$7C                A:0758 X:074D Y:01D0 P:eNvMxdizc
$82/A894 D0 03       BNE $03    [$A899]      A:0758 X:074D Y:01D0 P:eNvMxdizc
$82/A899 C9 70       CMP #$70                A:0758 X:074D Y:01D0 P:eNvMxdizc
$82/A89B B0 69       BCS $69    [$A906]      A:0758 X:074D Y:01D0 P:eNvMxdizc

$82/A89D 29 01       AND #$01                A:0758 X:074D Y:01D0 P:eNvMxdizc	; Mask
$82/A89F F0 03       BEQ $03    [$A8A4]      A:0700 X:074D Y:01D0 P:envMxdiZc
...

$82/A8A4 C2 20       REP #$20                A:0700 X:074D Y:01D0 P:envMxdiZc

$82/A8A6 AD 96 01    LDA $0196  [$00:0196]   A:0700 X:074D Y:01D0 P:envmxdiZc	; Load weather
										; 0x0 means sunny.
										; 0x2 means rainy.

$82/A8A9 29 02 00    AND #$0002              A:0002 X:074D Y:01D0 P:envmxdizc

; If not rainy, skip ahead--
$82/A8AC F0 03       BEQ $03    [$A8B1]      A:0002 X:074D Y:01D0 P:envmxdizc

; If it is rainy, goto IncrementTileValue to mark the tile as watered.
$82/A8AE 4C 06 A9    JMP $A906  [$82:A906]   A:0002 X:074D Y:01D0 P:envmxdizc
...

IncrementTileValue:
; This is a common path for all kinds of tile incrementing, it's not just for rain.

$82/A906 E2 20       SEP #$20                A:0002 X:074D Y:01D0 P:envmxdizc
; Load early-out cond
$82/A908 AF 19 1F 7F LDA $7F1F19[$7F:1F19]   A:0002 X:074D Y:01D0 P:envMxdizc
$82/A90C C9 03       CMP #$03                A:0000 X:074D Y:01D0 P:envMxdiZc	;
$82/A90E F0 59       BEQ $59    [$A969]      A:0000 X:074D Y:01D0 P:eNvMxdizc	;

; Load tile value
$82/A910 BF E6 A4 7E LDA $7EA4E6,x[$7E:AC33] A:0000 X:074D Y:01D0 P:eNvMxdizc

; Apply 'watered' status
$82/A914 1A          INC A                   A:0058 X:074D Y:01D0 P:envMxdizc

WriteRainEffect:
; X=0x74C means just to the right of shipping bin.
; Value of 0x59 means 'watered'.
$82/A915 9F E6 A4 7E STA $7EA4E6,x[$7E:AC32] A:0059 X:074C Y:01D0 P:envMxdizc

; Goto DoneProcessingTile.
$82/A919 80 4E       BRA $4E    [$A969]      A:0059 X:074C Y:01D0 P:envMxdizc
...

OnUntilledSoil:
$82/A91B E2 20       SEP #$20                A:0701 X:074F Y:01D0 P:eNvMxdizc
$82/A91D AF 19 1F 7F LDA $7F1F19[$7F:1F19]   A:0701 X:074F Y:01D0 P:eNvMxdizc
$82/A921 C9 02       CMP #$02                A:0700 X:074F Y:01D0 P:envMxdiZc
$82/A923 F0 44       BEQ $44    [$A969]      A:0700 X:074F Y:01D0 P:eNvMxdizc
$82/A925 C9 03       CMP #$03                A:0700 X:074F Y:01D0 P:eNvMxdizc
$82/A927 F0 40       BEQ $40    [$A969]      A:0700 X:074F Y:01D0 P:eNvMxdizc
$82/A929 AF 1B 1F 7F LDA $7F1F1B[$7F:1F1B]   A:0700 X:074F Y:01D0 P:eNvMxdizc
$82/A92D 29 03       AND #$03                A:0706 X:074F Y:01D0 P:envMxdizc
$82/A92F D0 38       BNE $38    [$A969]      A:0702 X:074F Y:01D0 P:envMxdizc	; Goto DoneProcessingTile
...

DoneProcessingTile:
$82/A969 C2 30       REP #$30                A:0059 X:074C Y:01D0 P:envMxdizc
$82/A96B FA          PLX                     A:0059 X:074C Y:01D0 P:envmxdizc
$82/A96C 7A          PLY                     A:0059 X:00C0 Y:01D0 P:envmxdizc
$82/A96D 8A          TXA                     A:0059 X:00C0 Y:01D0 P:envmxdizc
$82/A96E 18          CLC                     A:00C0 X:00C0 Y:01D0 P:envmxdizc
$82/A96F 69 10 00    ADC #$0010              A:00C0 X:00C0 Y:01D0 P:envmxdizc
$82/A972 AA          TAX                     A:00D0 X:00C0 Y:01D0 P:envmxdizc
$82/A973 E0 00 04    CPX #$0400              A:00D0 X:00D0 Y:01D0 P:envmxdizc
$82/A976 F0 03       BEQ $03    [$A97B]      A:00D0 X:00D0 Y:01D0 P:eNvmxdizc
$82/A978 4C 22 A8    JMP $A822  [$82:A822]   A:00D0 X:00D0 Y:01D0 P:eNvmxdizc

DoneProcessingField:
$82/A97B 98          TYA                     A:0400 X:0400 Y:01D0 P:envmxdiZC
$82/A97C 18          CLC                     A:01D0 X:0400 Y:01D0 P:envmxdizC
$82/A97D 69 10 00    ADC #$0010              A:01D0 X:0400 Y:01D0 P:envmxdizc
$82/A980 A8          TAY                     A:01E0 X:0400 Y:01D0 P:envmxdizc
$82/A981 C0 00 04    CPY #$0400              A:01E0 X:0400 Y:01E0 P:envmxdizc
$82/A984 F0 03       BEQ $03    [$A989]      A:01E0 X:0400 Y:01E0 P:eNvmxdizc
$82/A986 4C 1F A8    JMP $A81F  [$82:A81F]   A:01E0 X:0400 Y:01E0 P:eNvmxdizc
...
This provides enough information to understand how the 'watered' status gets applied. So to apply watered status irrespective of rain, you can just change the branch below
$82/A8A9 29 02 00    AND #$0002              A:0002 X:074D Y:01D0 P:envmxdizc

; If not rainy, skip ahead--
$82/A8AC F0 03       BEQ $03    [$A8B1]      A:0002 X:074D Y:01D0 P:envmxdizc

; If it is rainy, goto IncrementTileValue to mark the tile as watered.
$82/A8AE 4C 06 A9    JMP $A906  [$82:A906]   A:0002 X:074D Y:01D0 P:envmxdizc
to no ops. In other words, change
82A8AC: F0
82A8AD: 03
to
82A8AC: EA
82A8AD: EA
Expressing this as a PAR code, it looks like
82A8ACEA
82A8ADEA
See a demo of the change
It's a bit more fun this way. Enjoy
📅January 30th, 2022
On WDC 65816, NMI isn't a "real" instruction.
It's a directive ("non-maskable interrupt") typical 65816 assemblers understand.
You use the directive like
NMI MyHandlerwhere MyHandler is a label in the source code.
I had trouble finding this information written anywhere plainly, so I'm writing this in case you or someone else is in the same position as me where you need to know.
In response to NMI, the assembler doesn't directly emit any opcodes. What it will do for SNES, anyway, is
- After assembly, look at the object code address of MyHandler.
- The short, 16-bit address. Why? Because interrupts have to be in bank 0.
- Write the address to 0x7FEA or 0xFFEA, depending on whether it's LoROM or HiROM.
- The rule is that the vectors live in the last page of the first ROM bank, so that's in 0x7FEA for LoROM or 0xFFEA for HiROM.
Fun fact: in Geiger, you can't set a breakpoint to code inside an NMI. Well, you can try, but it won't hit. If you want to see control flow through an NMI, you can use the Logging-CPU feature.
After you assemble and load your program, and execute to something that entails an interrupt, your interrupt handler will get called automagically.
The choice of "what raises NMI" is up to the computer manufacturer. On SNES, the NMI vector is called when VBlank begins. That's just how it is. So sometimes NMI and VBlank get talked about interchangeably on that platform.
And I wish I had known to don't get hardware and software interrupts confused. NMI is different from BRK and COP. Those are software interrupts. They have an instruction, they launch from an opcode. NMI is a hardware interrupt.
For hardware interrupts, the K (program bank reg) gets automatically pushed, then the 16-bit PC is pushed, then the P (processor flags reg) is pushed, then there's this automatic transfer of control to the interrupt handler. You drop everything you're doing and go right to the handler. At least the CPU has the decency to push the execution state beforehand, I guess.
One detail- in emulation mode, the program bank reg does not get pushed. So you probably want to NOT be executing code in a nonzero bank in emulation mode if there's a hardware interrupt, because you don't know where to return to when the interrupt handler is done.
For NMI, the whole thing is no you can't disable it with a processor flag (that is, 'i') so forget trying to disable them either. And since it's a hardware interrupt, it's set up by special vector not by an instruction like BRK or COP. For those software interrupts, you can predict when they'll happen or make it so they're never happen since you know where there's a BRK or COP in your code. Hardware interrupts are different- you can't decide when they occur like that. The condition that raises them is fixed. Fortunately I guess, they're fixed based on something useful like vertical blank. And fair enough, since there are lots of things that are only safe to do during vertical blank.
I haven't had to write code that chases scanlines. I hope you don't either, although it might happen to everyone at some point.
A lot of the SNES reference material I used emphasize 65816 which is great for a while. But you get to a point in debugging SNES where it's not enough to only know things about the CPU. Eventually you will see things in the debugger you can't explain. Since there's more to a computer than just the CPU.