📅June 17th, 2023
I debugged this problem. I'm writing up the process so I remember what happened in case I have to go back to it, and for if you're running into a similar problem and you're looking for ideas.
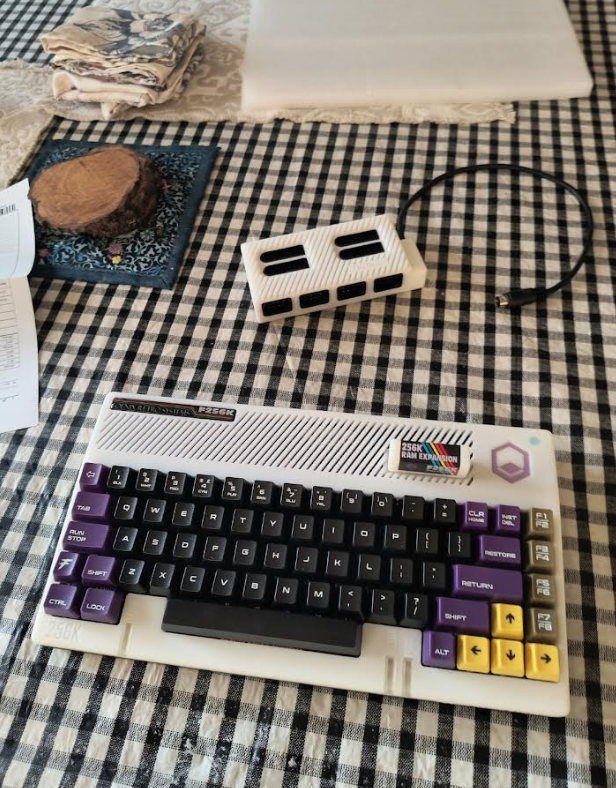
Symptom: Application starts, runs a little, then hangs mysteriously on the F256k.
First I narrowed down the repro. The application was originally written to do a bunch of things. I deleted a bunch of functionality to the point where it still reproed when simply trying to print text to the screen.
Step 1. Reproduce the problem on emulator
The repro was reliable on hardware, no issues there.
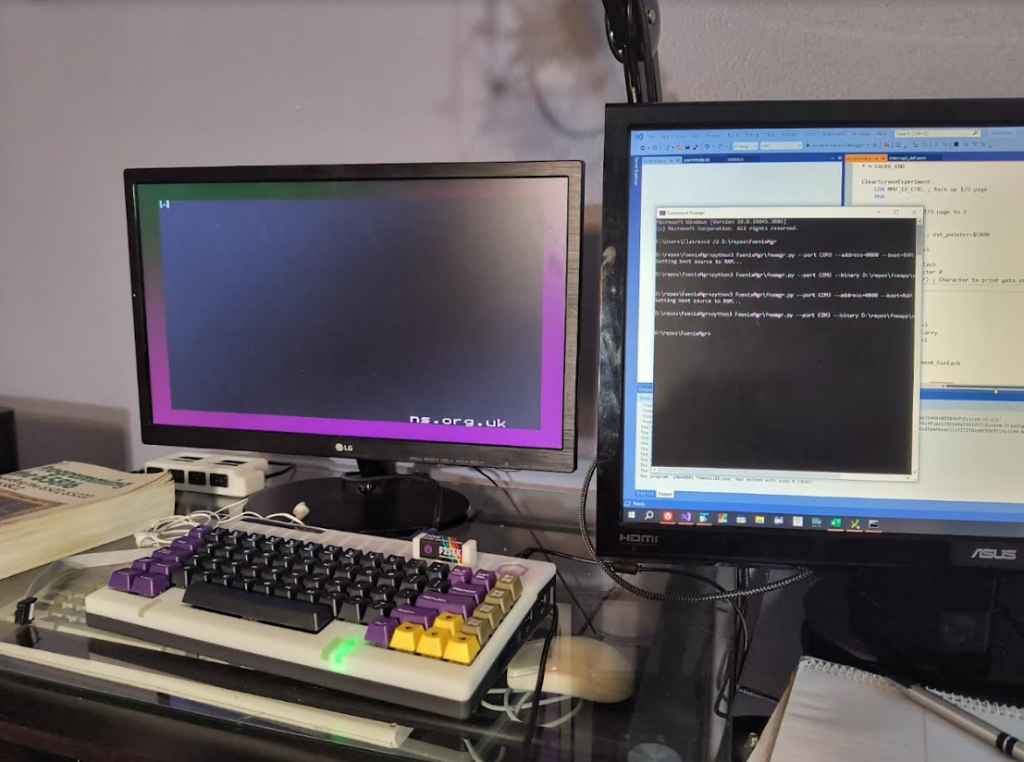
It's supposed to print the word 'Wormhole'. It stops at the letter 'W'.
What next?
How to get debuggability. Remote debugging F256 is on some people's minds and it's in the realm of possibility. There's a wired transport to a host computer, and allegedly a toolchain out there that could be made compatible with a bit of work. It's just not an established path at the time of this writing.
But what about the emulator? Fortunately, the Foenix emulator has a debugger built in. And while it's true a debugger is not strictly needed at all, it makes investigating a lot easier. So let's try running with the emulator.
To get the program compatible with emulator, I made a couple changes:
- Generate a .hex file, since the emulator knows how to load those and not 'bin'.
- Fix up compile offsets so that the program copes from being loaded at offset 0, not offset 0x800. Since with binary files you can specify where you want it loaded; with hex files you can't.
- Ideally, refactor things so the same source can be built in either of the two modes.
- Update the emulator to have compatibility with the 65816-based chip with F256, instead of just 6502, because that's the chip my unit has. This might not be strictly needed since my application code was all 6502-based at the time and runs in emulation mode, but it couldn't hurt to make sure I'm really comparing apples to apples and using an accurate emulation path. Plus it's support I would need later. The commit for this is here.
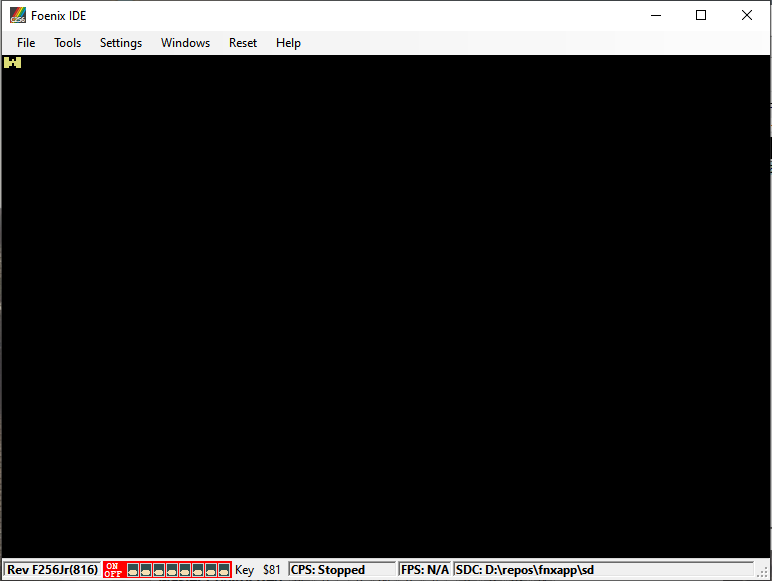
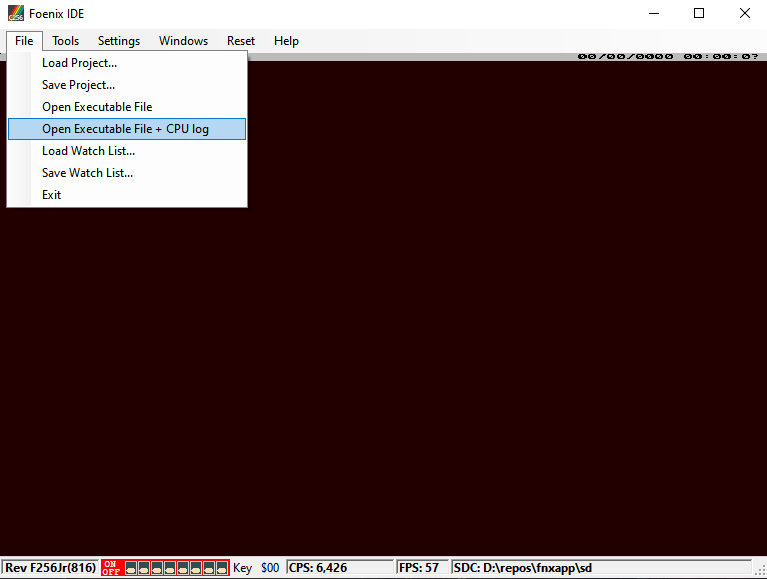
After making the above changes, the repro works on emulator:
Step 2. What kind of hang is it?
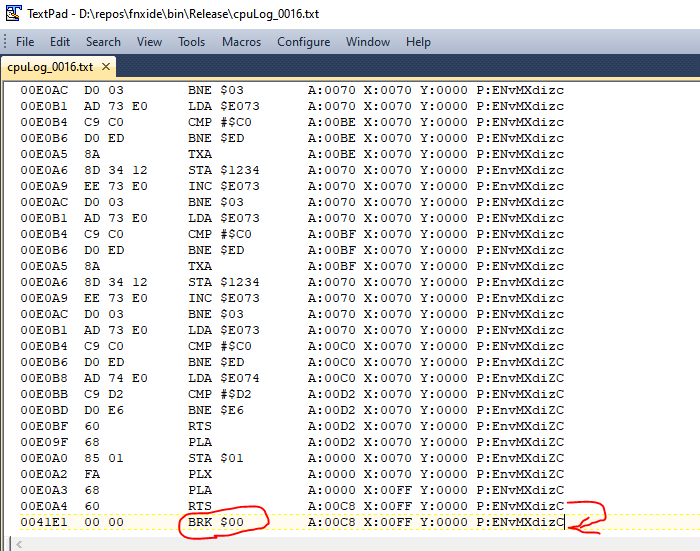
After running in the emulator, this was easy to see: it was a hang due to hitting a BRK. Not a spin, not a deadlock, not an invalid instruction. Simple enough.
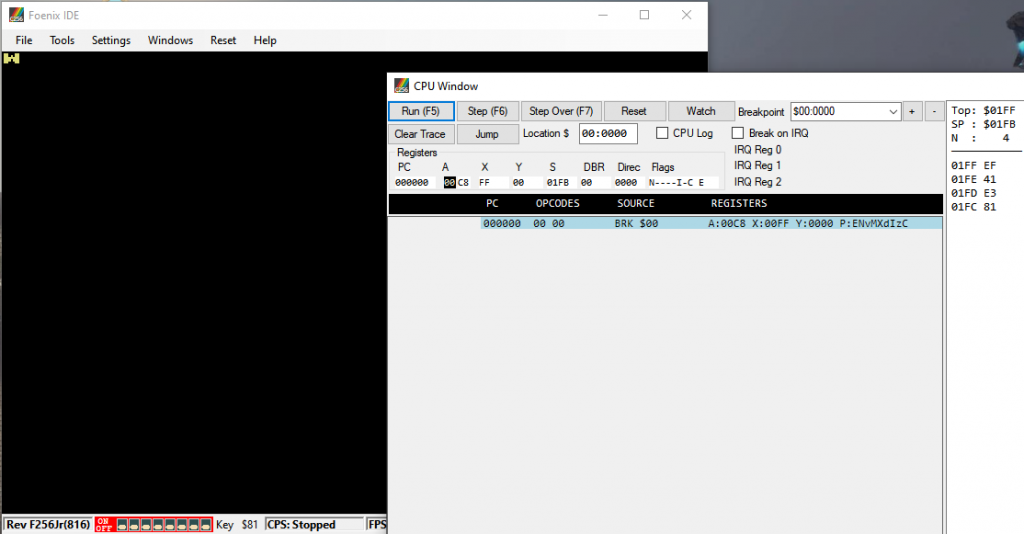
The location of the BRK itself it's saying is zero, not where my appcode was. So it's unclear how execution landed there. For a BRK on this emulator, I don't know that I necessarily trust the right program counter to be reported. It's enough to know that it hit a BRK though.
This is a case where time-travel debugging would immediately tell you the answer. Unfortunately, we don't have time-travel debugging. Fortunately, we have the next best thing: transcript debugging in the emulator with support that I added in my fork here.
Step 3. Working backwards
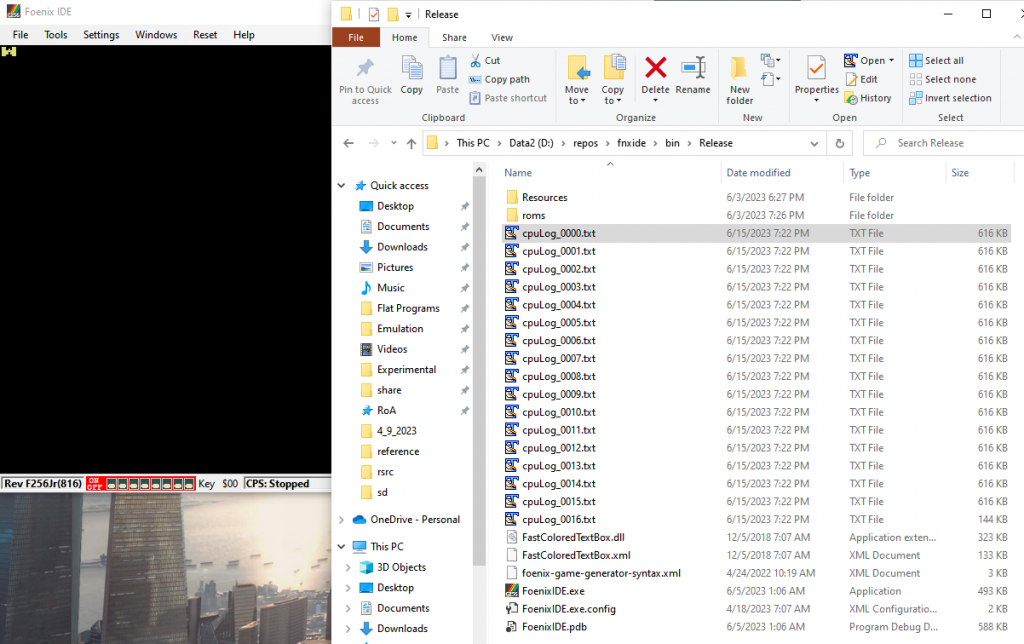
Re-launch the application with CPU log.
If I have to debug a hang I always hope it's a hang that halts the CPU. In this case where CPU logging is getting used, it's nice and convenient that the transcript will simply end when the program hangs. No need to guesstimate when to end it and sift through a bunch of noise.
And we're in luck today since BRK halts the CPU.
So after it halts, stop the program, take the transcript files that got emitted and open them.
Looking in the transcripts, everything looked mostly looked normal. What was curious is the hang happened quite early, before the things I considered more "risky" were ever executed. Before calls to our interrupt handler. Before even enabling interrupts. Before any changes to/from native and emulation mode. None of the usual suspects.
In the transcript, the 'what' it was doing made sense, but not the 'why'. There was some code that looked correctly executed. We're inside a function. That function returns. The place it returns to is not code, it's not really anything.
Some kind of stack corruption? Since the transcript isn't a full state of the machine, we don't know the stack. It's possible.
To find out more, let's compare the transcript to the assembly result.
Why use the assembly result, not source code? Because the assembly result shows code bytes and locations, which is super useful for this category of problem.
Matching up offset .e0a4 with what immediately came before the BRK, we see that the problem happens when returning from the function ClearScreen.
In the program there's only 1 call of ClearScreen, and that's from Main. That call is supposed to have pushed the return value on the stack, and we jump there.
For some reason, instead of returning up to 0x EF1F, the thing after ClearScreen's callsite, we return up to 0x41E1. That must mean something on the stack was overwritten.
Restarting the program, we can break a little earlier, stepping one instruction into the call to ClearScreen. It looks like this:
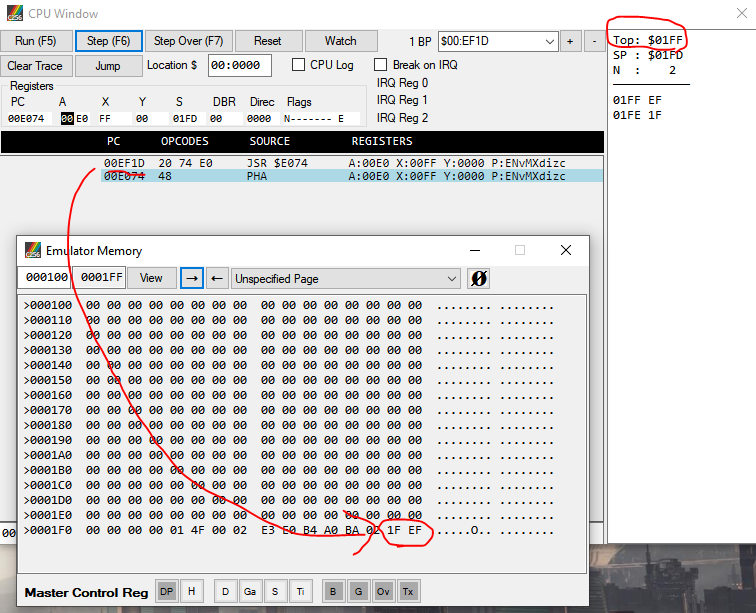
You can see:
- "Top: $01FF" means the top of the stack is at that location, and you can see the current SP, decremented, printed below.
- Looking at that location in the Emulator Memory window, it shows 0xEF1F.
- So the address-to-return-to is 0xEF1F. The bytes are swapped for endianness on this platform
Well that return-address makes sense. It's +2 from the call site which was 0xEF1D.
The value pushed to the stack is always supposed to be +2. In other words, it's one less than the next instruction. See this reference.
Something must scramble, or over-write this value later. What is it?
There are two options for finding out.
- Single step in the debugger a few instructions. If the scrambling occurred toward the beginning of the function, this would catch it quickly.
- Set break-on-write in the debugger. At the time of writing this, the debugger doesn't support memory breakpoints. So instead, hack the emulator, put in a temporary change to do this behavior.
Bad news. I tried a little of #1, and we weren't lucky enough for the problem to occur early enough to show the answer.
No worries, so option #2 it is.
Add a change to the emulator that hooks on write, something like this:
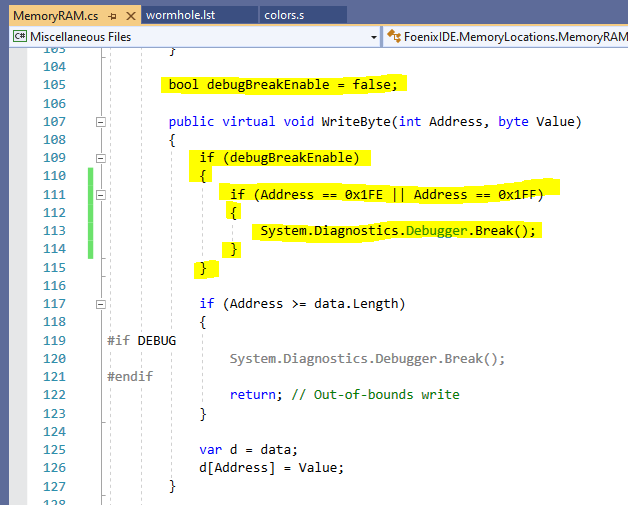
This "poor man's conditional breakpoint" let me track the pattern of pushes and pops to the stack. The process of doing this was a bit troublesome because I'd see different behavior based on whether I had debugger attached or not (terrific!)
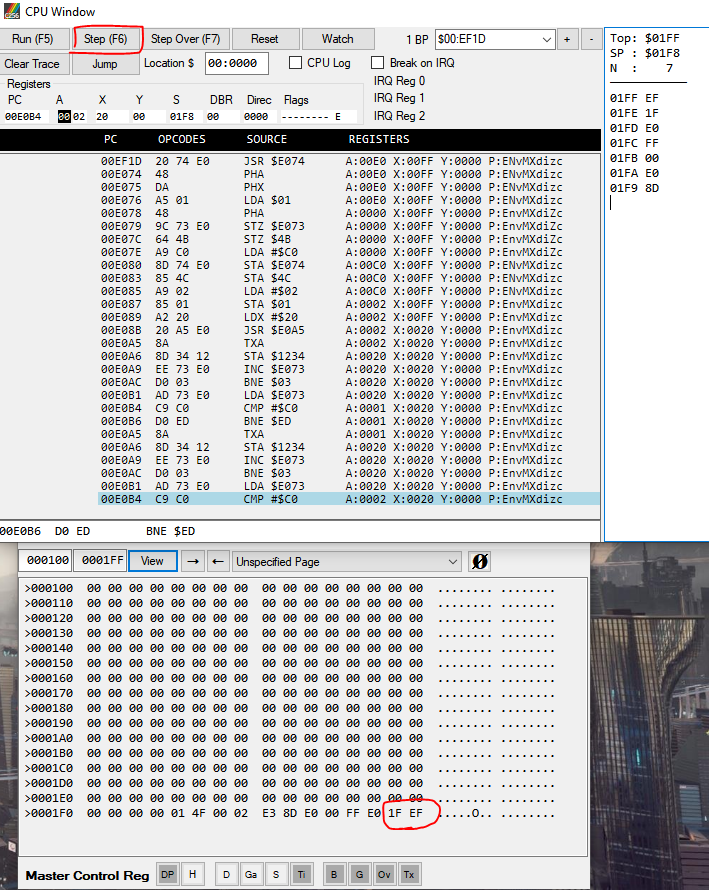
That said, I saw it hit, where a subsequent function call pushed a new return address to the same location. So that points to a return not popping off the stack.
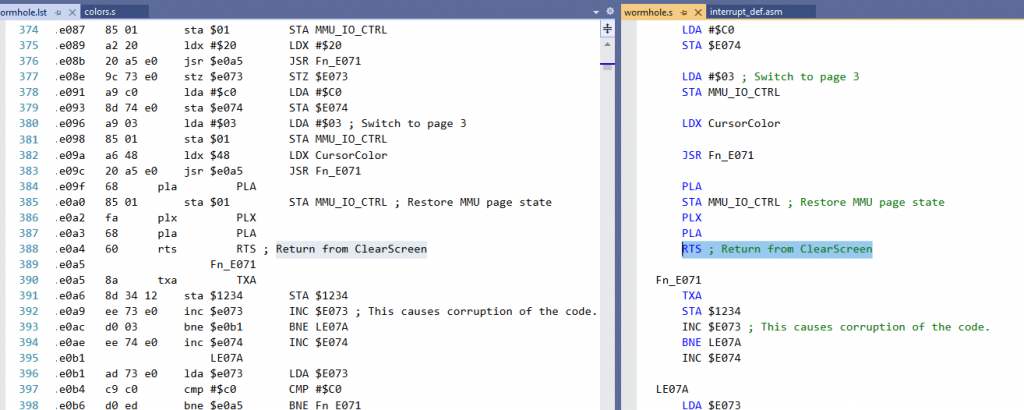
Now that we've confirmed that, the next step is to make sure it is really can do the return in this repro. To do that I look at the code bytes make sure they're really in the binary.
Wait a minute! There's a 0xC0 (CPY) instead of a 0x60 (RTS). The problem isn't just something scrambling the stack, something is overwriting code. One is causing the other. It must be bad code, that is scrambling the stack.
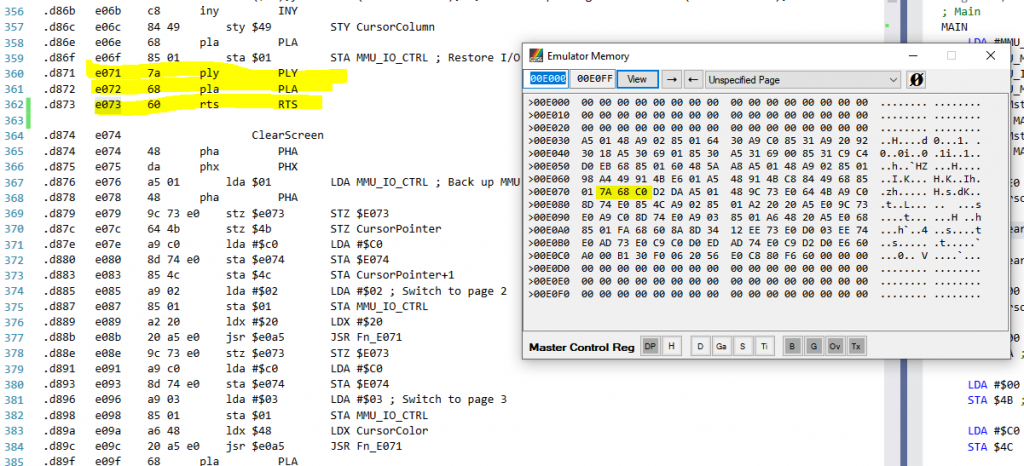
As a lazy effort, I looked in the assembly output for the address that gets scrambled, and there it was.
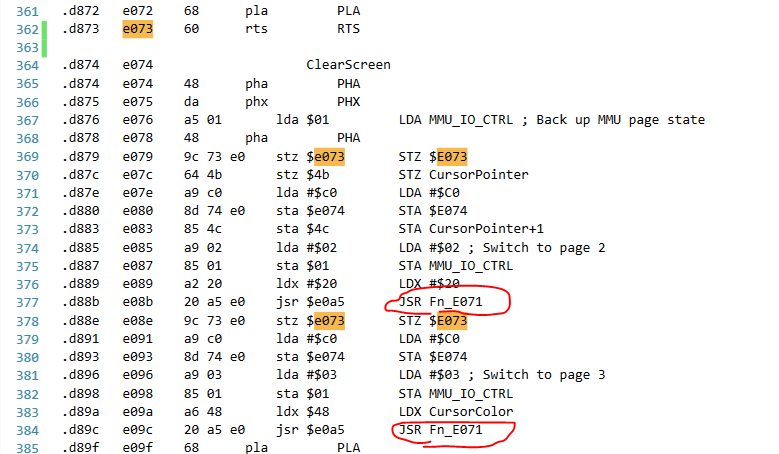
Those STZ and STAs are scrambling the return value and the byte after it, and then I noticed that Fn_E071 would scramble them further, reaching the pattern show in the earlier memory window screenshot.
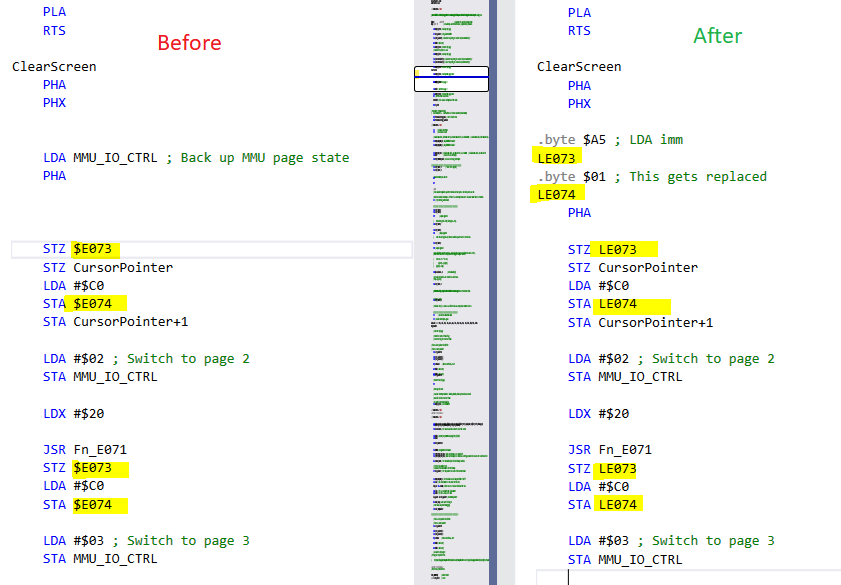
I didn't write this code to be self-modifying like this. I adapted this code from a sample, using some mix of tooling and manual disassembling. Well, there's the problem.
You see, $E074 used to point to data, the original version of this program. However, I inserted code which throws the label off. Because this memory was addressed by absolute address not by a label, inserting code invalidates it.
Correcting the code to key off of labeled:
And running the result
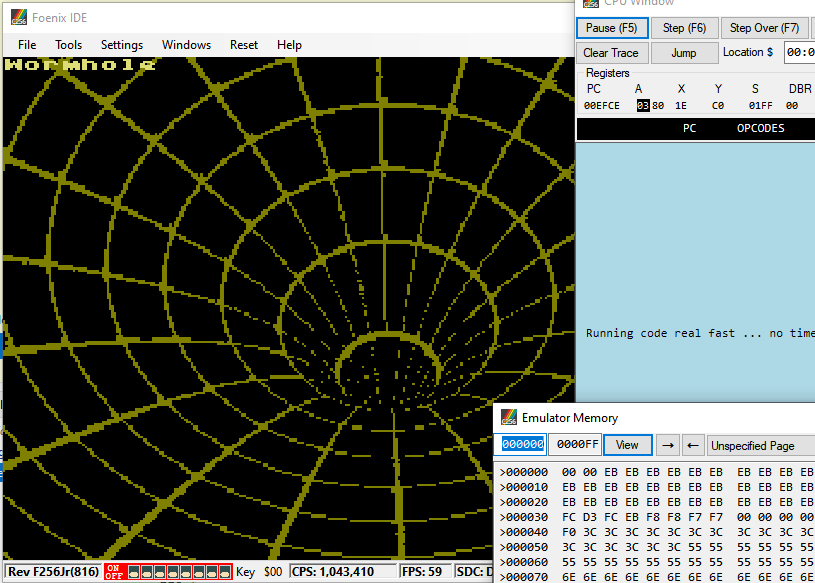
Success, you can see the whole text gets emitted and the rest of the demo runs as expected.
Patching the fix back into the whole application, and testing the whole thing on hardware:
That confirms the change above fixed the problem.
To build this demo, see the repository here. To run the demo, see binary releases here.
When developing my C64 game with KickAsm I used some macros around all my code blocks that would make kick write out a breakpoints file with every code memory address having a break on modify breakpoint. Then any time I accidentally stomped on memory, it would immediately break in the debugger instead of mysteriously crashing later on. Saved a lot of time!
June 18, 2023 @ 3:32 amAh, so the “poor man’s conditional breakpoint” not through an emulator, through instrumentation. I like that too
June 19, 2023 @ 2:13 pm