📅April 7th, 2026
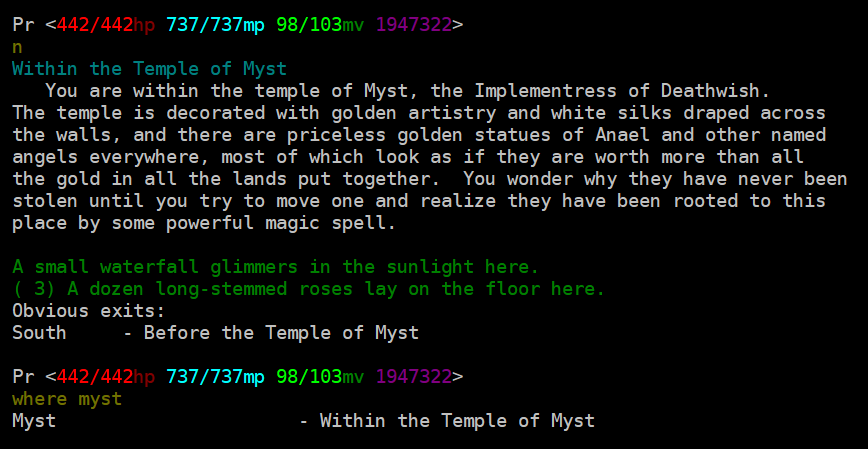
The MUD, also known as Aaezure Odyssey, is still online. It's accessible at
dwmud.org 1111by telnet. Or also through its old address, dw.kicks-ass.org.
I posted about this game before:
With a heavy heart I tell you its administrator, Myst, passed away last year. One of the others in the DW community let me know. Her personality and work were so influential in my young years. She was really accomplished and so beloved by the community. I miss her a lot. I know so others in the community. There is some more information on the MUD's Facebook page:
https://www.facebook.com/DeathwishMUD
The MUD is still online now, maintained by others in the community (e.g., Fantar). The web site for the MUD itself is not online at the moment, so in addition to sharing my feelings and sentiments I wanted to share the information for that.
📅January 18th, 2026
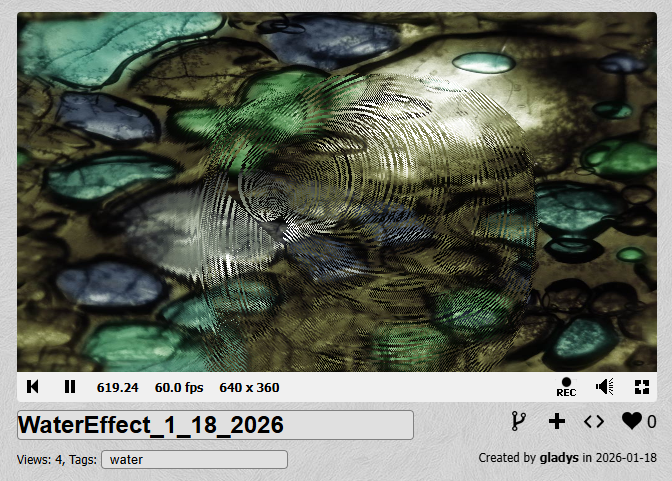
You know this 2D water effect with a two-buffer trick:
https://www.gamedev.net/articles/programming/graphics/the-water-effect-explained-r915
I made a version of it that runs in ShaderToy (a web application that runs GLSL fragment shaders):
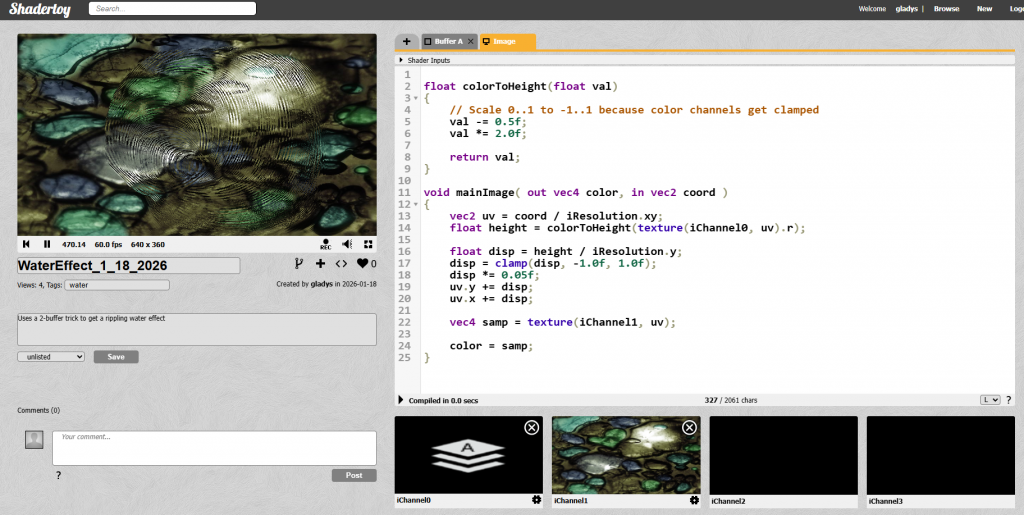
ShaderToy is very fun, just know it's not a fully programmable 3D pipeline.
If you browse people's samples for it you'll see people have done truly amazing things either in procedural geometry, or creating the appearance of 3D geometry using 2D approximations. Doing everything in screen space, lots of procedural rasterization of 2D shapes with no mesh. So anyway, if you're trying to port an algorithm that needs to sample from buffer A to write B, then swap the roles and read B write A, you have some open decisions on how to do it, since you don't have the usual level of flexibility over resource binding.
This method uses a hack of alternating writing to red and blue color channels of an intermediate. Since you can read from the target you're writing to, this way lets you read from the previous frame and the previous one to that.
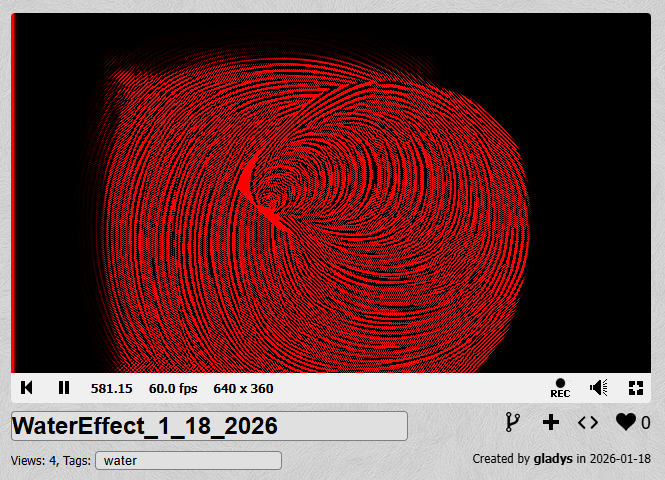
You can see how it's working if you view the heightmap single channel only:
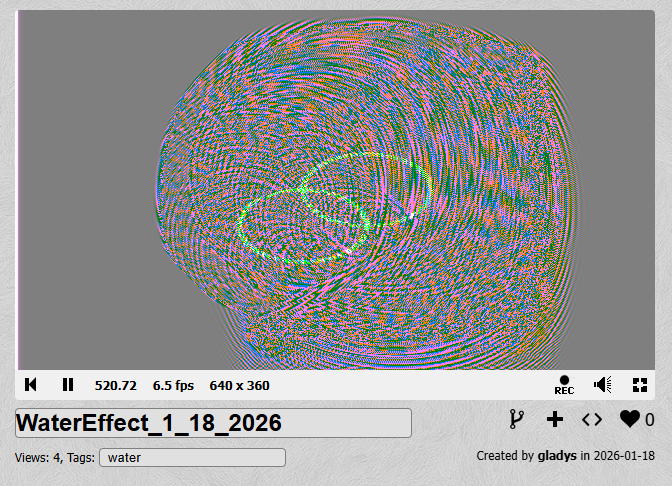
Or, viewing the raw heightmap data, you can see the two color channels together (with green sort of reserved as a debug channel):
The heightmap gets sampled and used to displace where an input texture of some rocks gets sampled. The end result is a 2D effect all in screenspace but it's a bit 3D looking.
You can see the demo here (works in most browsers):
📅January 9th, 2026
Suppose you know what your life is missing and that's Windows 98. You like the tactile feel of an actual machine. You don't want to use an emulator or a VM.
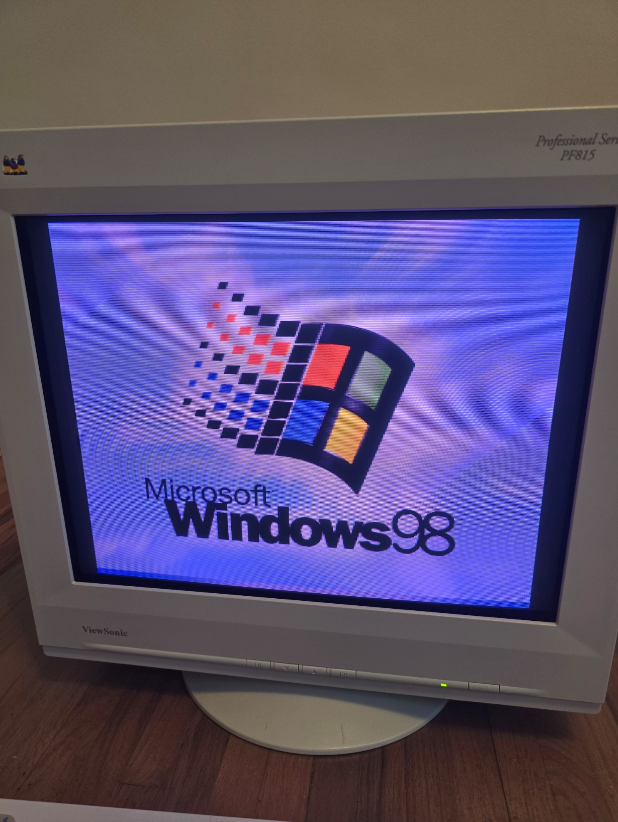
The good news is: yes, you can still set this up today. It's good to know what works and what doesn't, or what takes some effort.
This post describes a couple aspects of setting it up- drivers and networking- and what you can expect.
This is all general computer literacy tasks, not programming. Some of it isn't super obvious so I'm writing this for anyone that needs it.
Drivers
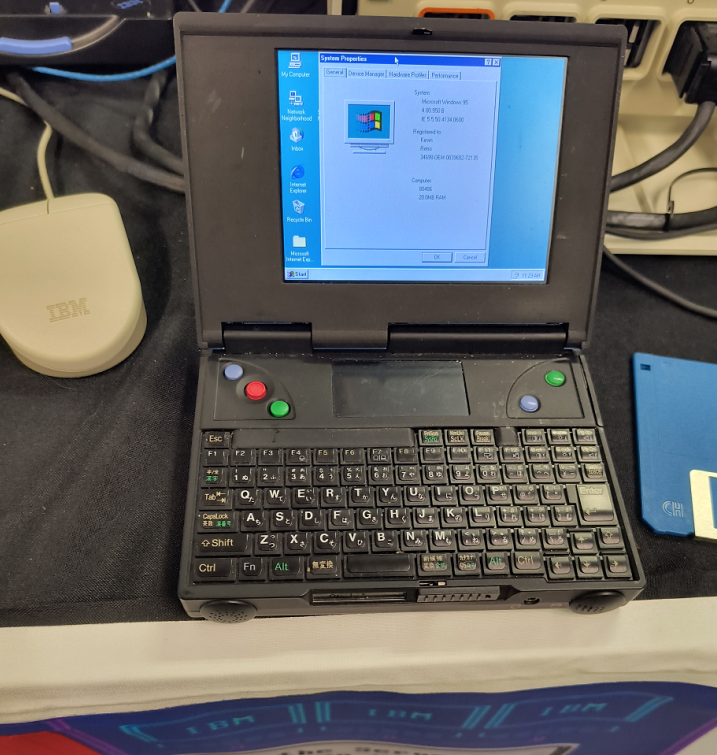
People don't like hearing this, but you'll have a lot better time using compatible hardware that could have reasonably shipped with Win 9x.
As in, hardware released at the time. Yes, you do see a lot of videos of "I set up Win95 on this new laptop", "I set up Win9x on this new gaming PC in a separate partition and got it enumerated in the bootloader", "Look, it works on this pocket organizer!" and it looks very impressive. There's one detail you'll usually see in those videos: they ONLY get so far as booting the OS. Maybe launch Paint and Calculator. They don't use network features, they don't use graphics acceleration, they might not even try to play sound, half the buttons don't work. They do horrible hacks, make delicate changes to system.ini, autoexec.bat, config.sys, try to fool the OS into enumerating different hardware caps. And they succeed, by some measurement of 'success', which is just booting the OS.
If your goal is just booting the OS and none of that other stuff, great.
If you want to use, say, really use the computer- use network features and connect to the Internet, you'll hit a wall. Use a non-PS2 mouse, you'll hit a wall. Potentially use the CD drive, you'll hit a wall. If you want to use the machine in any real way, you're limited. The OS doesn't live in a vacuum and it ultimately needs a way to talk to the hardware, and the inbox default drivers from the 90s are not future proof in the way you might be hoping. You probably want graphics, sound, network features from your hardware and those require drivers. Newer or unsupported hardware will not have Win 9x drivers and it is MUCH harder (technically possible sometimes but significantly harder) to hack your way to success around this.
Instead, why not go 100% immersion and use contemporary hardware?
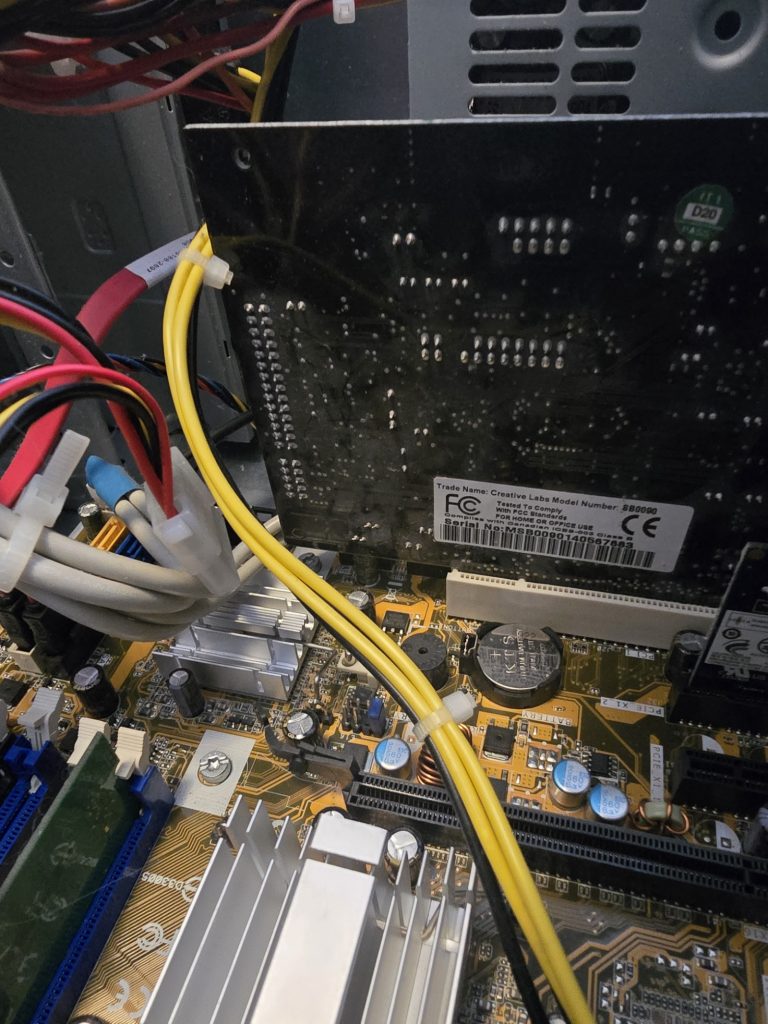
Get a Sound Blaster, get PS2 keyboard and mouse, get an old network card, get an old Voodoo, whatever, doesn't matter, get a low spec machine. I know it's a pain and there are some costs to doing this but you'll have to do way fewer hacks, and life will be better.
Wi-fi
Not strictly necessary, but it is nice to get some form of Internet connectivity. Depending on the layout of your home, you might not want to run a gigantic ethernet cable. The appealing option is wi-fi, then. You will have trouble using a real wi-fi dongle since there's unlikely to be compatible drivers. Also, in the OS, you'll notice Win9x can be configured against dialup and LAN and that's pretty much it. Any level of getting the OS to understand wi-fi directly needs to be provided by a driver. It will be hard to find that.
Fortunately, there's an actual connectivity method that's pretty easy.
Get one of these really inexpensive adapters that plug into an ethernet port, so your computer thinks it's LAN. Something like this.
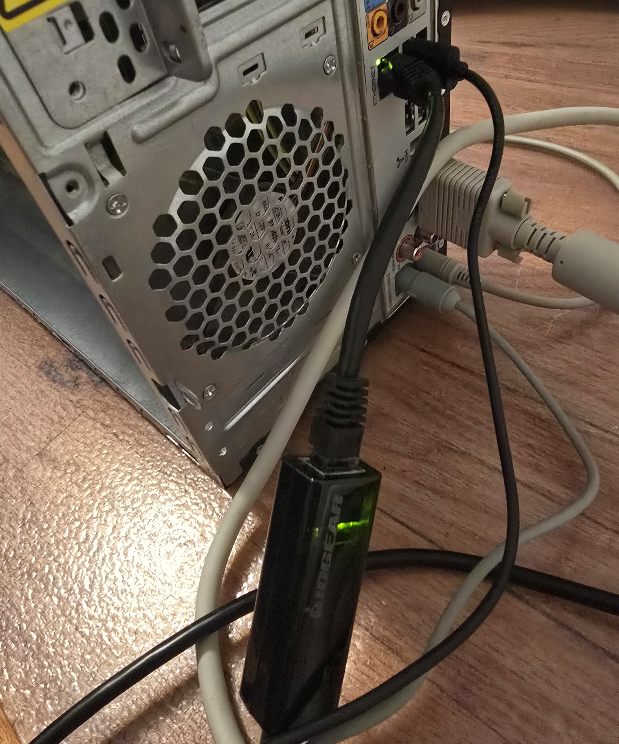
The connection to the computer is LAN, but the connectivity to the internet is over wi-fi. You set it up in a local gateway, set up the SSID and password there as needed, then tell the OS it's ethernet, done. Of course do this at your own risk, there are risks using any kind of internet adapter product plus some others mentioned below. This method is generally pretty easy and in fact, you can do it this way for pretty much any old device that only supports Internet over ethernet.
The Web
There's the actual question about what to do once you're online.
This question holds regardless of whether you connect over wi-fi or some other way.
Maybe you want to view web sites in a browser. This, I think you shouldn't try it. It's possible but not worth it. I'll explain why.
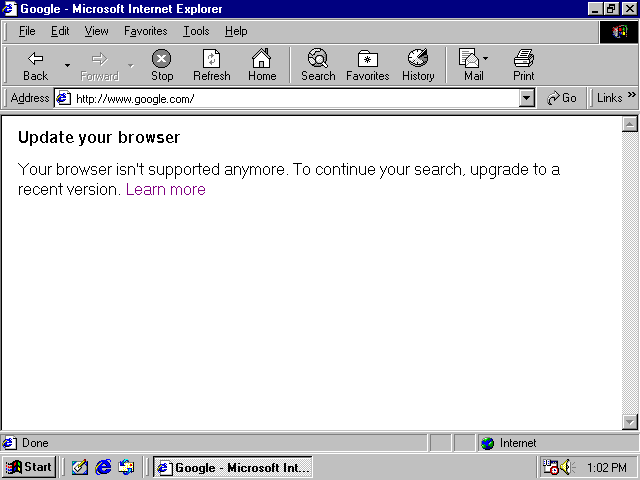
There are a couple obstacles keeping your old Win9x box from browsing the modern Internet. For example, if you try Google:
Or Wikipedia:
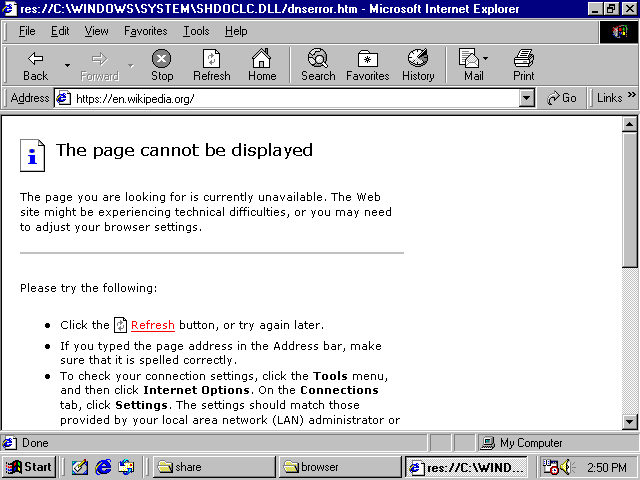
They don't load, and it's because of SSL.
Tilde.club does not use SSL:
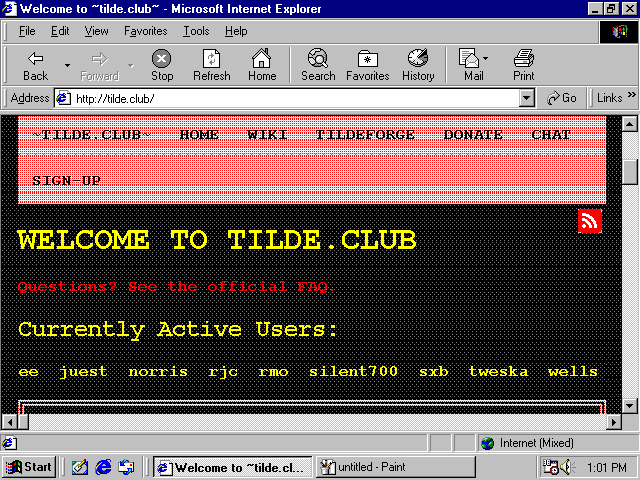
So it works but just looks a little screwy.
The inbox browser with Windows 98 is Internet Explorer 6. Some level of SSL can be enabled with Internet Explorer 6 as an optional feature or you can get it through other browsers. Still, it's not enough. SSL/TLS is not a yes or no. There are different versions and different encrypted key sizes and IE6's optional feature gives you only the most basic one. Other browsers will get you only slightly further along and that's it.
The exception is web sites that don't use SSL at all- there are only a handful of "WWW1" style sites around anymore, like tilde.club, and sometimes visiting them pops up all kinds of warnings in people's modern web browsers so they get avoided.
Note: People always talk about web pages as a platform as if they have this timeless works-everywhere quality. As if compat is king, compat was the utmost priority, and nobody ever deprecates older hardware.
Except, it's not true. The complete deprecation of old hardware has happened already.
The deprecation was for a good cause, to be clear. Without SSL, you're vulnerable to man-in-the-middle attacks. Someone could, say, set up their laptop at a coffee shop and create a hotspot for people to log into, and when you log into it, they can eavesdrop on credit cards, passwords, personal data, even change the communication that is sent to you or from you to others. But with SSL, this becomes a lot harder to the point where it's generally not done, and 'hacks' use some other mechanism. Despite what Youtubers shilling VPNs for 'security' will tell you, SSL by itself is actually very real and effective. The main benefits of those kinds of VPNs are usually location spoofing not security.The security you have through SSL is effective against many kinds of threats, coming at a cost of deprecating old hardware.
Second, the modern internet may be locked away from you because of the raw computation needed to load most pages.
The minspec for the modern internet has significantly risen over time. And if you followed my setup advice and used old, contemporary hardware, the good news is that you can get your computer working- yet, it may be too slow in terms of computation. It's a trade-off. I still claim the slower hardware is worth it, but that's the trade-off.
You can look at the raw disk size of the downloaded parts of modern web pages to get a sense, and imagine the computation needed to parse client-side scripts that size. In a fully advertising-driven Internet where web sites are playing with cat-and-mouse with ad blockers, web sites have nested divs upon nested divs with insane amounts of client-side processing. And no one is writing minimal, static pages anymore, even if those could deliver the same functions. Simple pages with a menu and a splash screen use HTML5 canvas, virtualized scrolling, and modal dialogs have changed from 'physical' (actual new pop-up windows, that create a new browser window) to 'virtual' (a fake window with an 'X' button overlayed on top of the page). Web site design is very tangled up with fashion, fashion changes, you don't want your web site to not look cool, and the fashion changed in favor of forcing us to buy new computers.
That's why if you connect your Win9x box to today's modern internet straightforwardly, you will have trouble viewing most web sites, even fairly minimal-looking ones if they are modern, and sometimes even if they aren't particularly modern.
With that, my recommendation is to
- Take a deep breath
- Make peace with the fact that while you can connect to the internet, web browsing is not really accessible to you. Use the internet for things which are not in a web browser.
When people say they want to functionally get web browsing on Win98, I think they're misrepresenting things. Because in actuality, they want to travel back in time to use and view the web sites from back then.
Like, say you want to re-live an old online multiplayer game. With some effort you can functionally run the game. But then you log on and there are no other players. Is that really what you wanted?
Unlike local computing, the internet is full of the content of other people. Your experience depends on that completely.
You could think of the internet beyond web browsing. Your Win98 box could use it more for file sharing without having to write disks or CDs or set up a serial cable. That's super useful. I think a giant struggle to access a partially functional modern internet through Windows 98 is not really worth it. That's my opinion on it though.
Tunneling
If you still need some form of web browsing and will stop at nothing, there are a few options that rely on, basically, tunneling through a 2nd computer.
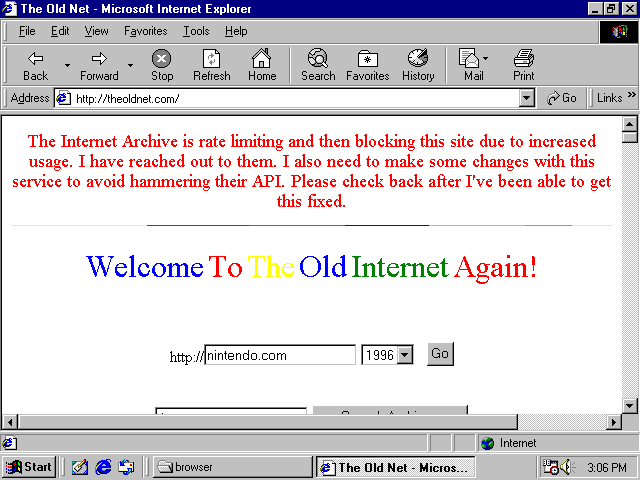
If it'd satisfy your craving, you could use a service like protoweb to access some curated selections of old sites from IE6.
Or you can use a portal like http://theoldnet.com, which does tunneling of some pre-blessed sites like Internet Archive and Wikipedia for you.
If you want to access any arbitrary site, a way to get pretty functional web browsing on Win9x OS today is to tunnel SSL content through a local web server that you own, and that local web server understands SSL. Then it sends back a page with no SSL to your retro machine.
For example, with this: https://github.com/snacsnoc/windows98-ie-proxy
Of course you need to make sure the connection between the Win98 box and the web server is trustworthy and be aware of security implications as you come across them.
That fixes the SSL part. It may only partially fix the 'lack of compute power' part, but is likely to be good enough.
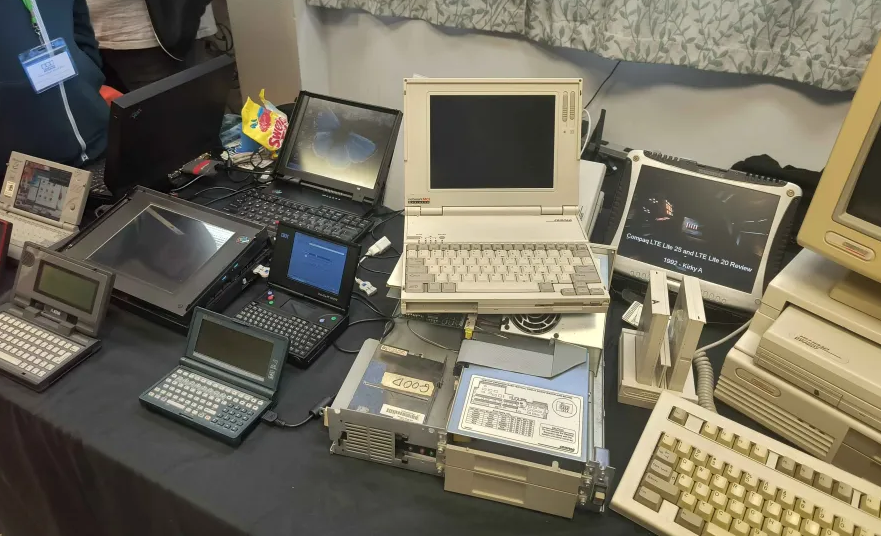
Fun aside: Fujinet! to enable internet (not really web browsing) on very old 8-bit computers, people have simply been solving it in hardware+software, not software alone, through the Fujinet project which is very cool! I saw a demo of this at Vintage Computing Festival. You buy a hardware peripheral and plug it in and that provides the extra compute power for internet connectivity, among a whole slew of other things. For HTTPS it could definitely be used to view some text-based content.
The methods of accessing the internet through Windows 98 discussed here don't involve offloading processing onto a local peripheral but there is offloading is to a remote proxy if you want.
Security
There's additional nuance thinking about security in these environments. I already mentioned some things you need to consider when setting up internet.
You should know, and probably know already, Windows 98 doesn't really do separation of user privilege, everything is basically run as administrator. And more of the driver model sits in kernel mode. And no security updates for anything- neither in the OS, nor drivers. So in some ways, opening up your retro machine to the internet is dangerous and risky.
On the other hand, today's bad actors are not targeting Windows 98 systems. Today's browser malware likely won't be compatible with the web browsing solutions you're using. There are some common app vectors that get targeted- Discord, Teams, WhatsApp- those won't be running in this environment. So in some other respects it is not so risky.
And you probably aren't daily driving in it. Or maybe you are. Here is where I was going to make a joke here about doing your banking over telnet.
📅November 9th, 2025
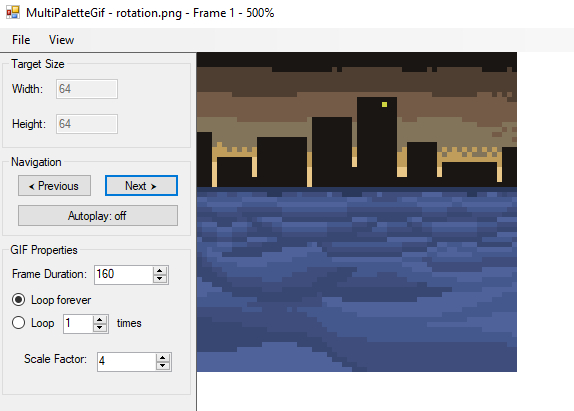
This post is about a handy palette rotation art tool I made recently.
It's really simple, you create a static image (e.g., a PNG file) in an external editor of your choice and it colorizes the result into a multi-palette GIF image file. You can preview and scrub through the frames as you make adjustments. Comes in handy since there are not a lot of modern art tools (that is- Win32 and not DOS, say) that prioritize support for indexed color much less make color cycling easy.
Talking to retro pixel artists nowadays I found none of them do color cycling art. Even when I offered to commission them. They indicated to me lack of toolchain is part of the reason why. They told me some other reasons, like they just find it tedious or they're not used to working that way, fair enough. I think it's a dying art sadly. This tool fixes the toolchain part.
I avoided having to invent a new file format by having a kind of convention for representing palette data at the top of your source image. There's a mini specification for it. Basically, you list out a 'reference palette' that your framebuffer will be comprised of, and then a set of N palettes that will be used to color the final image. The result animation will have N frames. Each palette is prefixed by a magenta pixel, as a delimiter. This is convenient for easy editing and offers some flexibility in how you want it to appear in the document.
Example source image:

What it looks like in the program:
Result if you hit 'save':

I find it easier to use grayscale for cycled colors but obviously it's up to you.
You can do color cycling like for the water example above, or just a recoloring like the yellow lights.
Before doing this project, I didn't actually know that GIF supported multiple palettes since I never really looked into it. For most GIFs I found around the internet whenever I bothered to look, they used one global palette. And the tools I used for creating GIFs didn't expose options for multi-palette. But, it is supported in the underlying format. If you're using Windows Imaging Component to encode GIFs, use an indexed color format like GUID_WICPixelFormat8bppIndexed and call IWICBitmapEncoder::SetPalette on the frames to set it. That's how this tool does it anyway.
Link to project: https://github.com/clandrew/MultiPaletteGif/
You can download the latest release here.
📅October 14th, 2025
For old closed source games, machine decompilation of the binary into C is not some magic pathway into full reverse-engineering. I am so sick of this hyper fixation on decompilation into C at all costs even if done by machine. It is fine but no it's not some magic pathway to having all your questions about a game answered.
It's like say you're being asked to write an essay doing character analysis of a Shakespeare play. And you think that translating the play into current-day English would fix all your problems.
To write the essay, you STILL face these open problems of "what this character's motivations are", "how do they relate to others", "why were they written this way". You still have these problems, whether the play's in Elizabethan English or not. The newer English might help, but that's it.
In the same way for a decompiled game, you still face these open problems of "what function is responsible for this behavior", "the data at this memory address, what does it mean", "what is the compression scheme for this data?". The decompilation might make it easier to read, but that's it.
For the essay, you might in fact prefer to do it in the original Elizabethan English instead of use the modern translation. Because, you can make connections based on wordplay and repeated motifs, and ensure nothing was lost in translation.
In the same way you might prefer using the original binary and not solely use decompilation. Because generally, you can't debug the decompilation. Most people don't try to re-compile the decompilation, and anyway the decompilation is not "round-trippable"- it doesn't produce something equivalent to the original when compiled, so you'd have no idea if you're debugging something representative. If it even works. (SOME PEOPLE DON'T COMPILE THE DECOMPILATION. I am losing my mind at this) So, everyone basically just does static analysis. And there's only so far you can get with static analysis.
For people who have machine decompilations of games, you can try asking them questions about the code. Although the code is supposedly in this easier form, they won't know. Or at least, they'd have to do some digging, which they'd have to do anyway even if they didn't have decompilation. Machine-decompiled code has placeholder everything- function names, data identifiers, labels. The code flow alone tells you nothing.
I guess I'm claiming decompilation can save you some work but it's not THAT much work, and no it's not some magic solution to all your problems.
The hyper fixation on "having complete source code in C" even if machine-generated is incredibly dumb and kind of irrational. There's a littering of projects that present themselves like they're "done" simply because they've done this. Or for any project, it is not regarded as "done" unless there's a full decompilation of the whole game into C, even if machine generated. Like say I use a machine translation to put a Shakespeare play into modern English, and then the result is littered with wrong grammar, misplaced slangs and nonsensical garbage and will need a ton of human massaging to get it anywhere close to legible. But hey it's in modern English!!!
I saw someone use tools to "decompile"-- I think it was [name redacted] for SFC, this project to reverse-engineer the game, and it was literally just a bunch of data rips and a machine generated decompilation. Like. Why start there?? The machine generated decompilation is not anything, how about you take a small piece, replace some symbols and decompile it yourself as a human.
As an aside, some people do decompilation as a desire to "uncover the mystery of the orignal source code", to feel like they've recovered the original source code, including for old games.
Well for SNES era games and earlier, the games were written in assembly language mostly since there wasn't yet a good C toolchain for those platforms. So if that's your motivation, you're better off doing dissassembly not decompilation. For 65816 the register width and addressing modes are a runtime decision between 8 and 16 bit, not a statically known decision, so you can not even robustly statically dissassemble but you can have tools that guess with a heuristic and possibly get it wrong sometimes if you are ok with that.
Also, I see some people use decompilation to recover data, which is kind of absurd. It's not necessary. You can just find the data and rip it, if uncompressed.
📅December 17th, 2024
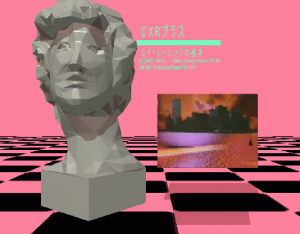
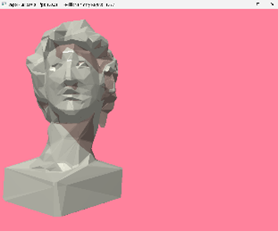
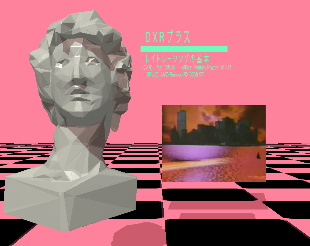
A while ago I wrote this DirectX Raytracing (DXR) test application. It looks like this
The application is hosted on GitHub, here: https://github.com/clandrew/vapor
Time passed, and app rotted to the point where it doesn't run anymore.
This blog post explains some background about the app, why it rotted, and how I fixed it.
About this app
This a toy application that's an homage to a popular album cover.
The Helios statue mesh I threw together in 3DS Max, besides that there's some textured cubes. There's Direct2D-rendered text, interroped with 11on12 to get textured onto a D3D12 cube geometry. Nothing too crazy. A secondary ray draws a shadow on the floor. There's a raster-based screenspace effect you can toggle on and off.
I wrote it back when DXR support was brand new in Windows. Back then, seemed good.
Fast forward to recently, when I tried it again, cloned and built it and it just crashed on startup.
For context, I originally tested this application on NVIDIA GeForce GTX 1070 (pre-native-RTX support). Nowadays I was testing it on AMD Radeon RX 6900 XT.
What happened between then and now
Back when I wrote it, this application originally used the D3D12 Raytracing Fallback Layer. You can see some remnants of this in the application.
Quick side note about the fallback layer-- "isn't that just WARP?" The fallback layer is different from WARP, and it's also different from DXR(!) It shipped as a completely separate-but-very-similar API as DXR, separate headers and everything, calling into D3D12 API itself. Like, typically you have to recompile to use the fallback layer. You can't just swap in a different DLL or change some toggle at runtime or something. If you squint you'll see that a few parameters are different compared to DXR. The fallback layer implemented a DXR-like interface on top of compute workloads.
While WARP acts more like a driver, the fallback layer is more like middleware. And while WARP is all CPU, the fallback layer is agnostic to that question. In practice I usually used fallback layer on top of GPU though.
Since the time this application was written, WARP was actually updated to support DXR.
And since the time this application was written, I updated the application itself to use DXR.
However, because of the timeline of when this was written versus the availability of actual DXR hardware, the application didn't get battle-tested on actual DXR nearly as much as it did on fallback layer. Since the fallback layer is a totally parallel implementation, you can get some difference of behavior and levels of strictness between it and actual DXR. Also, we have more varied and more baked implementations of DXR now compared to then.
So I suspected the rotting was from a combination of the app changing, and being ported (from fallback layer to DXR) and the underlying environment changing (maturity of DXR implementations with more varied strictness and fault tolerance), and this ended up being true.
Problem 1: Scratch resource is the wrong size
When I ran the application it just crashed silently.
To investigate this I did the first thing I always do which is enable SDK layers. This is validation on CPU timeline.
It showed me
ID3D12CommandList::BuildRaytracingAccelerationStructure: pDesc->ScratchAccelerationStructureData + SizeInBytes - 1 (0x0000000301087cc7) exceeds end of the virtual address range of Resource (0x000002532BE82EC0:'UpdateScra', GPU VA Range: 0x0000000300f8f000 - 0x0000000300f9996f). [ RESOURCE_MANIPULATION ERROR #1158: BUILD_RAYTRACING_ACCELERATION_STRUCTURE_INVALID]Basically, this showed there was a bug in the app where the scratch resource used for the acceleration structure update was the wrong size. Scratch resource sizes are platform and situation dependent so it must have been that I ‘got lucky’ when this app was run before.
This was super simple, I fixed it to use the correct size reported from GetRaytracingAccelerationStructurePrebuildInfo().
Problem 2: Resource binding disagreement
The application still crashed so that this point I enabled GPU-based validation. As of the time of writing this, SDK layers GPU-based validation offers a lot of coverage of some general scenarios which are pipeline agnostic (e.g., incorrect resource barriers, attempting to use unbound resources, accessing beyond the end of a descriptor heap), while it doesn't include much in the way of DXR-specific validation, so I wasn't betting on it showing a problem of that category.
When I ran GBV (GPU-based validation), it showed
DescriptorTableStart: [0],
Descriptor Heap Index FromTableStart: [0],
Descriptor Type in Heap: D3D12_DESCRIPTOR_RANGE_TYPE_UAV,
Register Type: D3D12_DESCRIPTOR_RANGE_TYPE_SRV,
Index of Descriptor Range: 0, Shader Stage: PIXEL,
Root Parameter Index: [0],
Draw Index: [0],
Shader Code: PostprocessPS.hlsl(140,15-15), Asm Instruction Range: [0x22-0xffffffff], Asm Operand Index: [0], Command List: 0x000001CCFE6A2FC0:'Unnamed ID3D12GraphicsCommandList Object', Command List Type: D3D12_COMMAND_LIST_TYPE_DIRECT, SRV/UAV/CBV Descriptor Heap: 0x000001CCFE8479F0:'DescriptorHeapWrapper::m_descriptorHeap', Sampler Descriptor Heap: 0x000001CCFE8525D0:'m_samplerDescriptorHeap', Pipeline State: 0x000001CCFEA72720:'Unnamed ID3D12PipelineState Object',  [ EXECUTION ERROR #939: GPU_BASED_VALIDATION_DESCRIPTOR_TYPE_MISMATCH]
So this was happening not during the ray tracing, but in the raster pass that runs right after.
This was showing a disagreement between my shader and app code. Shader calls something a :register (t0), which should correspond to an SRV, but the resource binding was a UAV.
Generally when there are disagreements like these, the behavior is undefined.
For example, a while ago I remember seeing a bug in a D3D11 application where the C++ said a resource was a Texture2DMS, while the shader code called it a Texture2D. This resource got bound and shader code did a sample from it. Well on some implementations, the implementation would 'figure it out' and somehow find a way to treat it as a single-sampled resource. On others, it would be device removed. The level of fault-tolerance is really up to the GPU implementation. If it's your bug, ideally you can catch it proactively.
Again, I think I was ‘getting lucky’ with this before, where the underlying implementation could figure out what to do with the disagreement. Fast forward to today, the implementation I tried it on was strict.
Anyway, I fixed this by changing the resource binding to be SRV. Easy enough.
Problem 3: Case of the missing geometry
After fixing the above things, the application runs and doesn't crash. That said, it doesn't yet have correct behavior.
It's supposed to look like
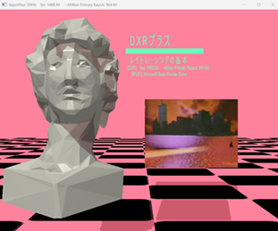
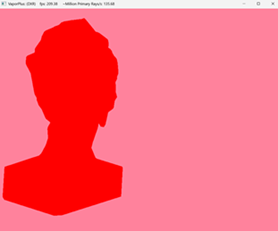
Instead, it looks like
The floor, and billboarded image and text are missing. It’s a little strange, since this demo’s acceleration structure contains 4 geometries- 3 very simple ones and 1 more complicated one—and it’s the simple ones that were missing.
As a quick check, I tried the app on WARP and the missing geometry did not repro with it. It also did not repro on NVIDIA. Therefore the problem looks specific to when the application is run on AMD platform. It's likely the application is doing something incorrect that is getting lucky on the other platforms, where AMD is strict. Whatever it is, it's not being caught by SDK layers, so the next step is to narrow down the problem and probably to use graphics debuggers.
As an educated guess I first added some extra flushes (UAV barrier on null), to rule out the possibility of missing barrier. It made no difference, so that ruled that out.
Next I forced the closest hit shader to be dead simple, return hardcoded red, and disabled raygen culling. For this application, the closest hit shader (CHS) does a bunch of stuff to evaluate color based on material then casts a secondary ray for the shadow. If simplifying the shaders like this showed the simple geometries in red, that would mean the problem is in CHS or raygen.
The result looked like
Meaning, the problem was not in raygen or CHS, but something about the acceleration structure (AS).
As an additional step to narrow things down, I disabled updating of the AS, so the AS is only built once as the application launches. This made it so the scene doesn’t animate any more (normally the statue ‘floats’ up and down). If this were to fix it, it would tell me there’s a mistake in my updating of the AS. This too didn’t make a difference.
So the problem is not in the updating of the AS, but in the creation of the AS.
With that I took a closer look at the AS.
The latest public release of PIX (version 2409.23 at the time) actually showed empty AS with NaN bounds:
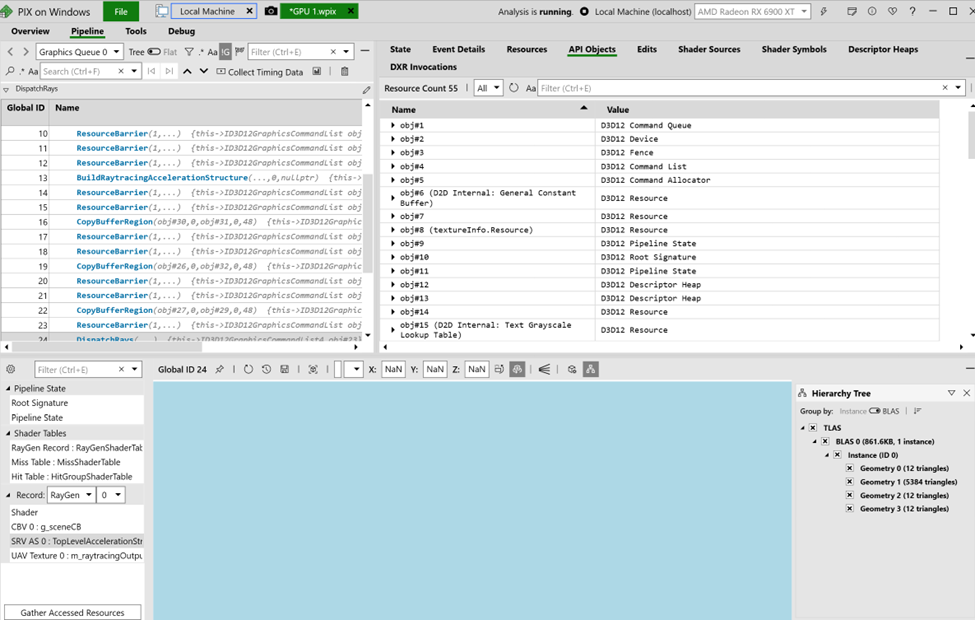
further confirming something was wrong on that front.
To get more information about the BLAS I used AMD's public tool, Radeon Raytracing Analyzer (RRA).
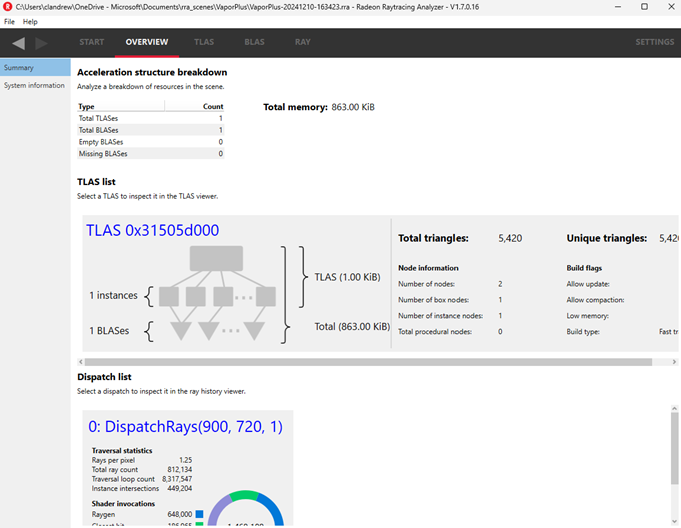
The BLAS tab showed the visible mesh, and not the invisible ones, as expected:
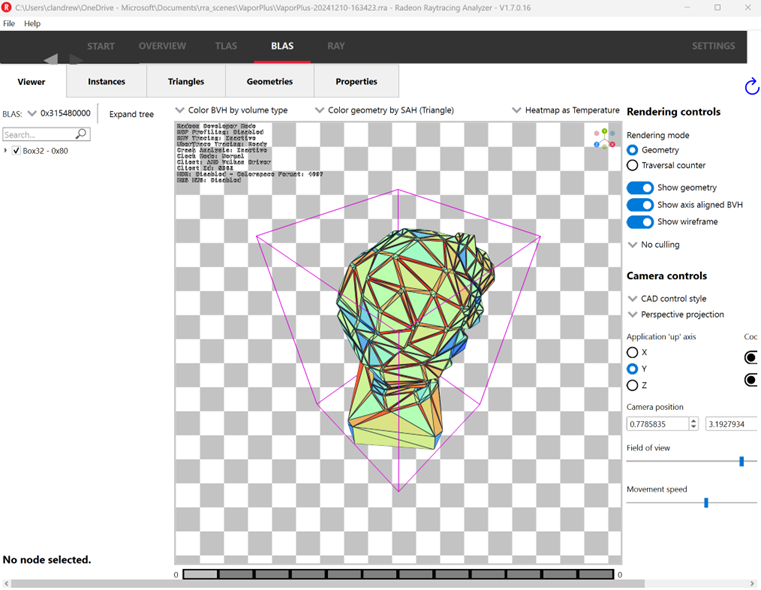
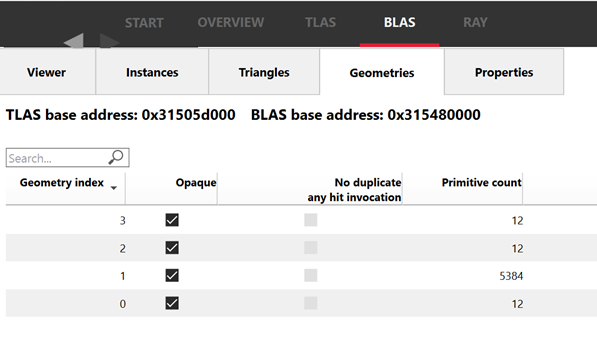
In the “Geometries” tab, I saw something reassuring. All 4 of my geometries were there with the right primitive counts.
But in the “Triangles” view is where things looked wrong. All triangles showed as coming from primitive ID 1, and none from other primitive IDs:
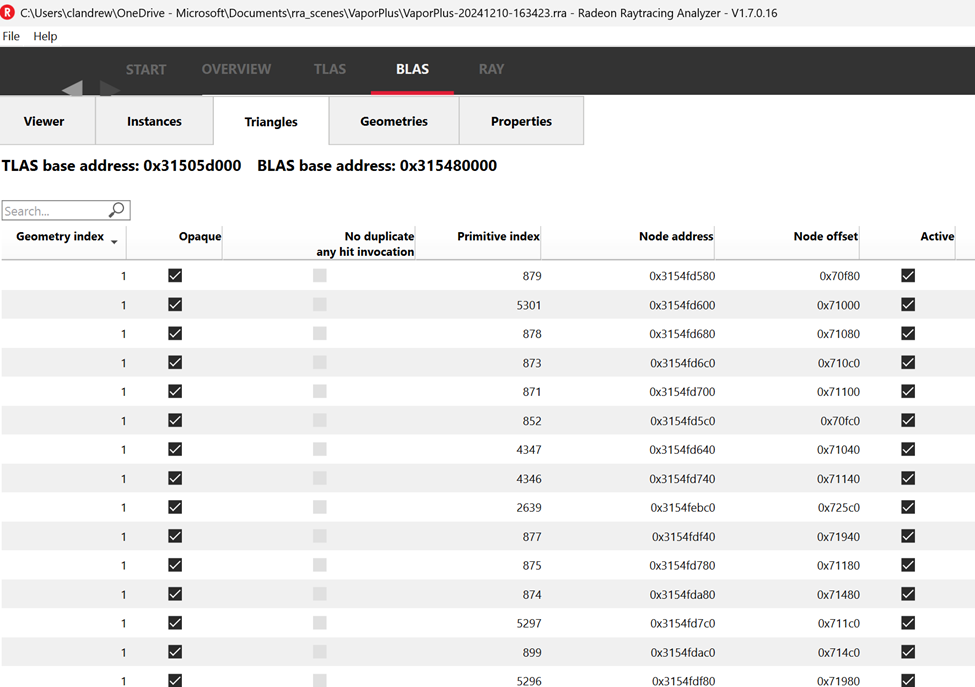
This means something was going wrong with BLAS creation. Geometries with valid primitives are going in, and no triangles are coming out.
With that, I took a closer look at the actual descs being sent to the BLAS build.
On that front, I noticed that the order of the mesh loading seemed to matter. The mesh that works is the one that gets loaded first, at vertex buffer (VB) index 0. Then the subsequent meshs’ data get appended at the end. Indices get incremented straightforwardly to the index buffer (IB). All 4 meshes share the same VB and IB. This clued me into something being wrong in how the descs were set up.
The problem ended up being this:
typedef struct D3D12_RAYTRACING_GEOMETRY_TRIANGLES_DESC {
  D3D12_GPU_VIRTUAL_ADDRESS            Transform3x4;
  DXGI_FORMAT                          IndexFormat;
  DXGI_FORMAT                          VertexFormat;
  UINT                                 IndexCount;
  UINT                                 VertexCount;
  D3D12_GPU_VIRTUAL_ADDRESS            IndexBuffer;
  D3D12_GPU_VIRTUAL_ADDRESS_AND_STRIDE VertexBuffer;
} D3D12_RAYTRACING_GEOMETRY_TRIANGLES_DESC;
The important field is VertexCount. The app was setting VertexCount to be the number of vertices needed for each mesh.
If you look at the DirectX Raytracing spec in the section for D3D12_RAYTRACING_GEOMETRY_TRIANGLES_DESC:
| UINT VertexCount | Number of vertices (positions) in VertexBuffer. If an index buffer is present, this must be at least the maximum index value in the index buffer + 1. |
The VertexCount actually has a slightly different meaning from how the application was treating it, it’s more of a ‘limit’ from the start of the vertex buffer, not just the count that that desc has. For example if a mesh only consisted of 1 vertex at position 5000 in the vertex buffer, it needs to have a VertexCount of around 5000, not 1. It’s IndexCount that would probably be 1.
Once I changed VertexCount to agree with the spec, the missing geometry was fixed:
After fixing that 3rd and final problem, everything is working well again.
To download this application, see the Release posted here:
📅October 4th, 2024
For me this has come up when people are describing or categorizing different computers, trying to compare capabilities or different things about them. They use terms like "8-bit computer" or "16-bit computer" or "32-bit computer" to categorize something. You get the gist. It's fine. Nothing wrong with that.
It does become a problem when we actively lie to ourselves and pretend like these are specific technical terms.
I've run into way too many 'smart' people who are deluded of this.
Bitness (of a computer) is a marketing term, not a technical term. It describes how you feel about a computer, what the vibe is, like what sort of capabilities it reminds you of, what time period it makes you think of. There is not some universal test, there is not some hard specific qualifier for bitness, and it is not a hard technical category. Not for the computer, and not even bitness of the CPU. It's useful for general conversation and marketing purposes, just not more beyond that.
If there were a technical definition for bitness of a computer, or say the CPU, what would it be?
One dude I talked to once said "well, it's technically pointer size". So what about the Super Nintendo. Its pointer has 3 bytes: low, high, bank. Except literally nobody says that, everyone calls SNES a "16-bit console". Or the classic example of the TurboGrafx-16, marketed as a "16-bit console". Except the pointer size is 8 bits, only the graphics adapter and its transport is 16bits.
Or consider the modern 64-bit Intel processors you use today. Do you think you have a full, viable 64-bit pointer? You don't, maybe you already know, only the lower 48 bits are viable. Check it yourself. In Intel computers available today you'll never have a program with two pointers that differ by the upper 16 bits. In fact I had to debug something that squirreled away metadata in the upper 16 bits, and just stripped them and fixed it up anytime it had to dereference. This fat pointer thing is something you can do today if you want, because we don't really have a full 64-bits of pointer.
Like, the point of words is so you can say things and have people understand you. So for defining words, I go with how the world uses it. In this case the world isn't agreeing on one consistent, technical category, so if you think there is one you're fighting a losing battle.
If you go by things like "pointer size" or "general purpose register width" to determine bitness of a computer, sometimes there's choices. For Super Nintendo or any 65816-based computer, not only does it have an 8-bit 6502-style legacy mode, it has 8-bit native mode and programs are constantly switching back and forth between 8-bit and 16-bit register widths and addressing. So if you go by register width you could call it an 8-bit or 16-bit computer. Or say for Win16 with segmented memory model on Intel x86, you have near and far pointers which are 16-bit or 32-bit respectively. Or for modern Intel-based CPUs you have viable pointer amount and the actual amount that is passed into a dereference. I know I'm mixing a bit of high and low level here. This is choosing different, but I think fairly reasonable interpretations of what it means to use a pointer.
I'm not saying any of this is a big deal I'm just saying there can be choices. And usually, when there's a choice, you pick the bigger one. Because, the bigger number sounds better. Because it's a marketing decision.
Describing a computer using "bitness" is super useful to get a general feel for the time period it came out. What order of magnitude of size is the system memory. What is the screen resolution and color depth. Could it have 3D acceleration. Could it have chiptune sound or something more.
It stops being useful if you have to write an emulator, write an operating system, write a device driver, write a compiler, even to write application code. Then, you'll want to know what's the actual behavior, what kind of pointers do you have, what can you do with them, probably width and interpretation of native types would be good to know.
Anyway, I've come across a type of person on occasion that is completely adamant that there is a hard technical definition of bitness of a computer. You don't want to be that type of person, being just so certain that there is one but not being able to imagine or explain to anyone what it is.
📅June 17th, 2023
I debugged this problem. I'm writing up the process so I remember what happened in case I have to go back to it, and for if you're running into a similar problem and you're looking for ideas.
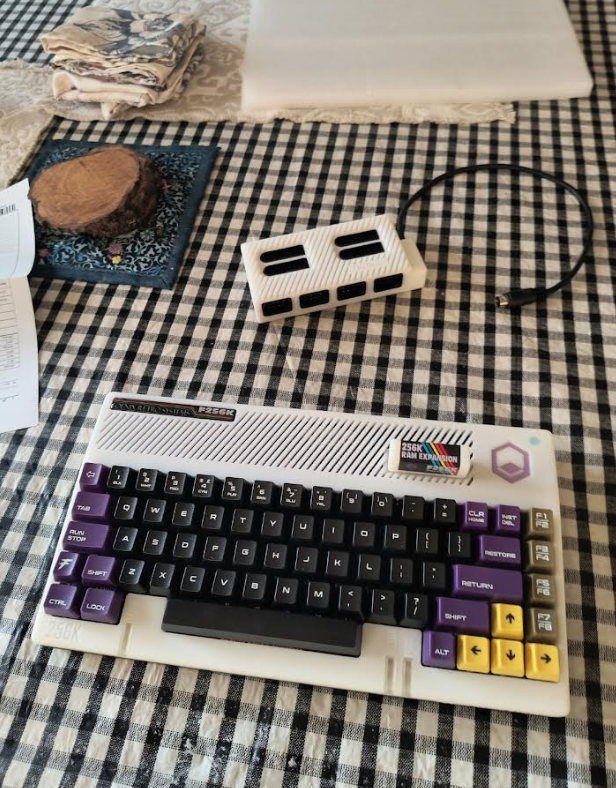
Symptom: Application starts, runs a little, then hangs mysteriously on the F256k.
First I narrowed down the repro. The application was originally written to do a bunch of things. I deleted a bunch of functionality to the point where it still reproed when simply trying to print text to the screen.
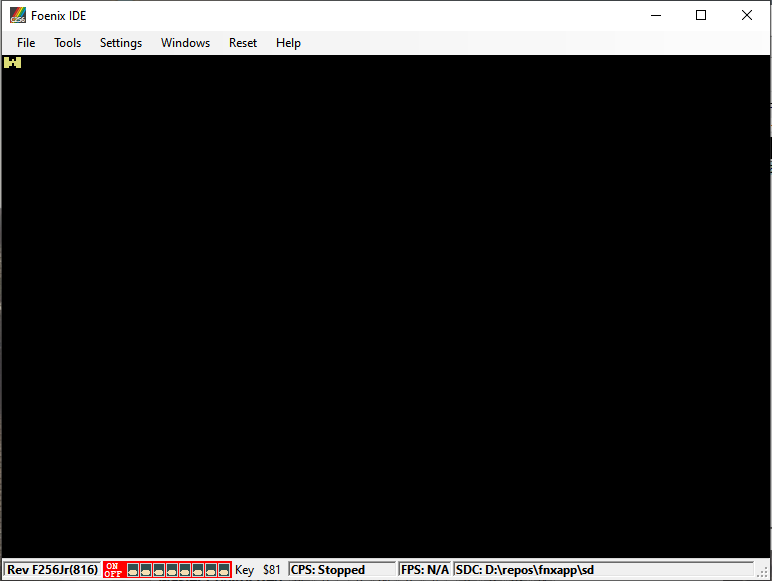
Step 1. Reproduce the problem on emulator
The repro was reliable on hardware, no issues there.
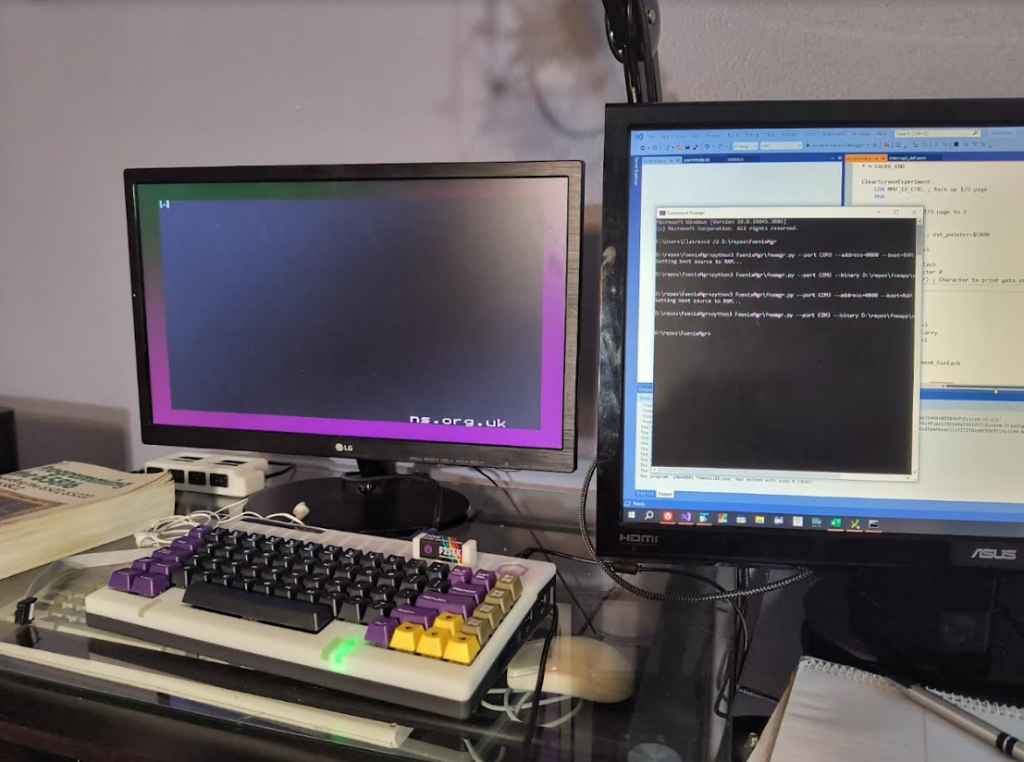
It's supposed to print the word 'Wormhole'. It stops at the letter 'W'.
What next?
How to get debuggability. Remote debugging F256 is on some people's minds and it's in the realm of possibility. There's a wired transport to a host computer, and allegedly a toolchain out there that could be made compatible with a bit of work. It's just not an established path at the time of this writing.
But what about the emulator? Fortunately, the Foenix emulator has a debugger built in. And while it's true a debugger is not strictly needed at all, it makes investigating a lot easier. So let's try running with the emulator.
To get the program compatible with emulator, I made a couple changes:
- Generate a .hex file, since the emulator knows how to load those and not 'bin'.
- Fix up compile offsets so that the program copes from being loaded at offset 0, not offset 0x800. Since with binary files you can specify where you want it loaded; with hex files you can't.
- Ideally, refactor things so the same source can be built in either of the two modes.
- Update the emulator to have compatibility with the 65816-based chip with F256, instead of just 6502, because that's the chip my unit has. This might not be strictly needed since my application code was all 6502-based at the time and runs in emulation mode, but it couldn't hurt to make sure I'm really comparing apples to apples and using an accurate emulation path. Plus it's support I would need later. The commit for this is here.
After making the above changes, the repro works on emulator:
Step 2. What kind of hang is it?
After running in the emulator, this was easy to see: it was a hang due to hitting a BRK. Not a spin, not a deadlock, not an invalid instruction. Simple enough.
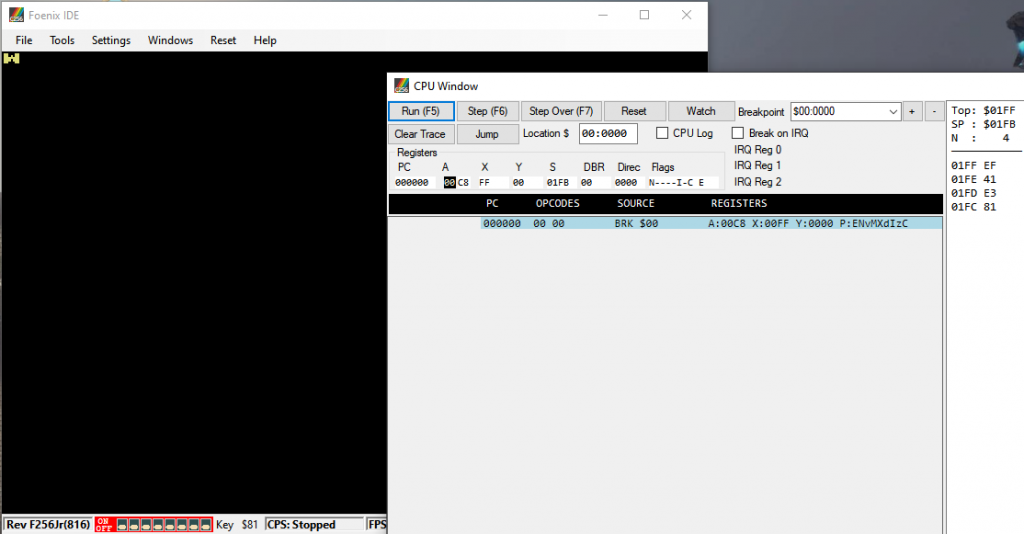
The location of the BRK itself it's saying is zero, not where my appcode was. So it's unclear how execution landed there. For a BRK on this emulator, I don't know that I necessarily trust the right program counter to be reported. It's enough to know that it hit a BRK though.
This is a case where time-travel debugging would immediately tell you the answer. Unfortunately, we don't have time-travel debugging. Fortunately, we have the next best thing: transcript debugging in the emulator with support that I added in my fork here.
Step 3. Working backwards
Re-launch the application with CPU log.
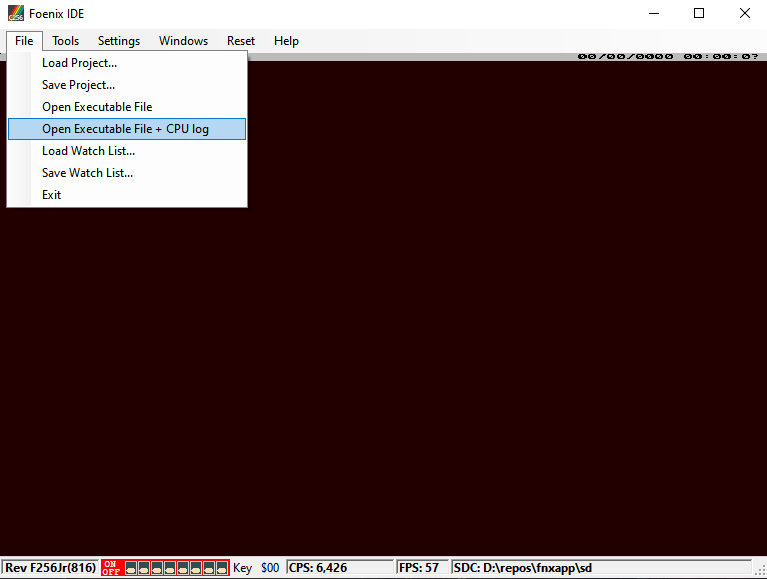
If I have to debug a hang I always hope it's a hang that halts the CPU. In this case where CPU logging is getting used, it's nice and convenient that the transcript will simply end when the program hangs. No need to guesstimate when to end it and sift through a bunch of noise.
And we're in luck today since BRK halts the CPU.
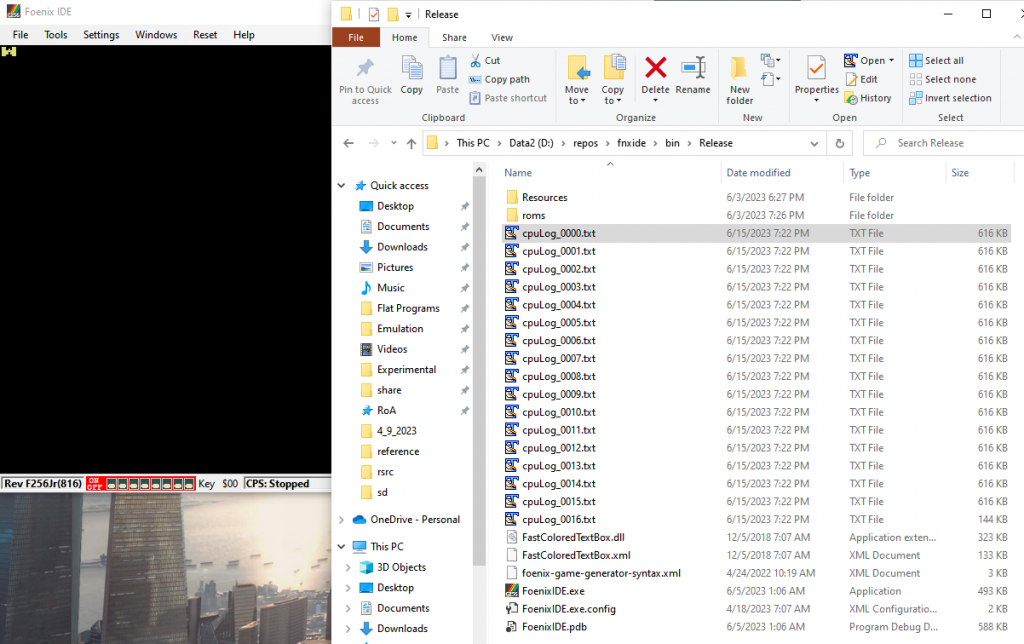
So after it halts, stop the program, take the transcript files that got emitted and open them.
Looking in the transcripts, everything looked mostly looked normal. What was curious is the hang happened quite early, before the things I considered more "risky" were ever executed. Before calls to our interrupt handler. Before even enabling interrupts. Before any changes to/from native and emulation mode. None of the usual suspects.
In the transcript, the 'what' it was doing made sense, but not the 'why'. There was some code that looked correctly executed. We're inside a function. That function returns. The place it returns to is not code, it's not really anything.
Some kind of stack corruption? Since the transcript isn't a full state of the machine, we don't know the stack. It's possible.
To find out more, let's compare the transcript to the assembly result.
Why use the assembly result, not source code? Because the assembly result shows code bytes and locations, which is super useful for this category of problem.
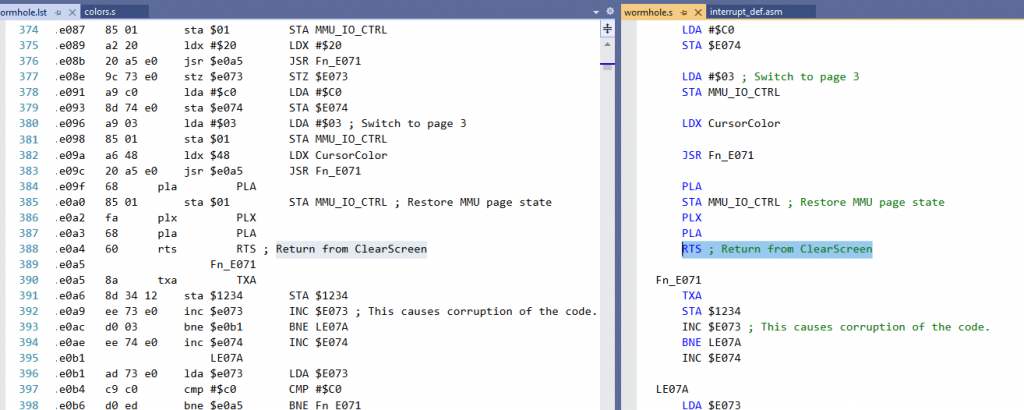
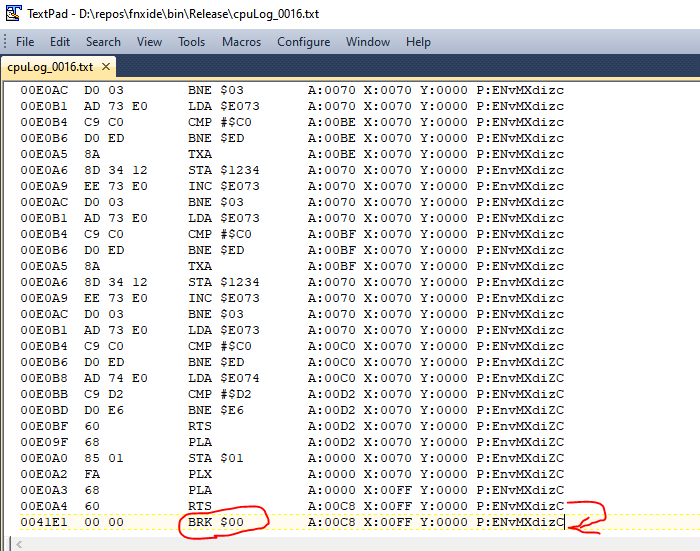
Matching up offset .e0a4 with what immediately came before the BRK, we see that the problem happens when returning from the function ClearScreen.
In the program there's only 1 call of ClearScreen, and that's from Main. That call is supposed to have pushed the return value on the stack, and we jump there.
For some reason, instead of returning up to 0x EF1F, the thing after ClearScreen's callsite, we return up to 0x41E1. That must mean something on the stack was overwritten.
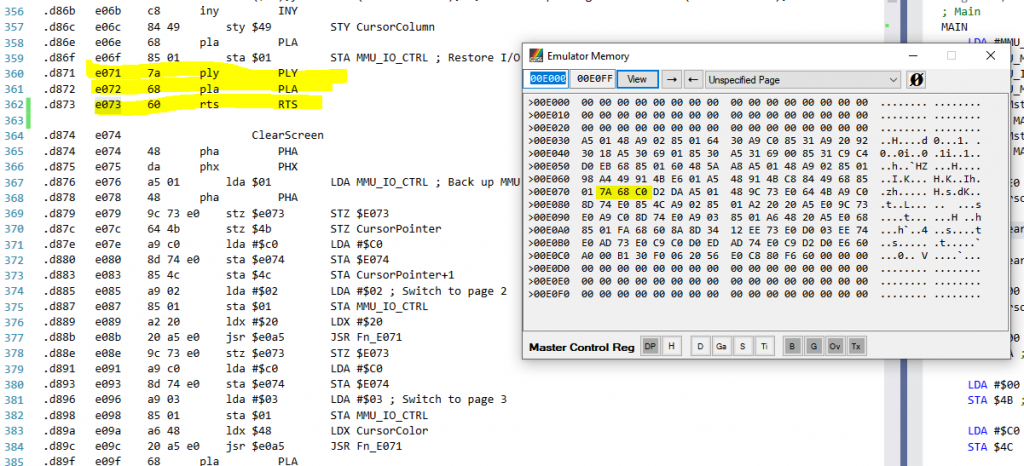
Restarting the program, we can break a little earlier, stepping one instruction into the call to ClearScreen. It looks like this:
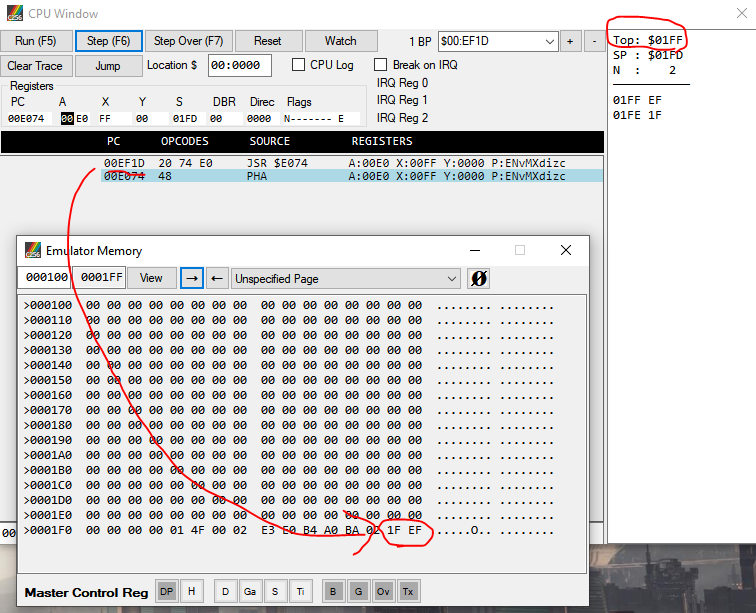
You can see:
- "Top: $01FF" means the top of the stack is at that location, and you can see the current SP, decremented, printed below.
- Looking at that location in the Emulator Memory window, it shows 0xEF1F.
- So the address-to-return-to is 0xEF1F. The bytes are swapped for endianness on this platform
Well that return-address makes sense. It's +2 from the call site which was 0xEF1D.
The value pushed to the stack is always supposed to be +2. In other words, it's one less than the next instruction. See this reference.
Something must scramble, or over-write this value later. What is it?
There are two options for finding out.
- Single step in the debugger a few instructions. If the scrambling occurred toward the beginning of the function, this would catch it quickly.
- Set break-on-write in the debugger. At the time of writing this, the debugger doesn't support memory breakpoints. So instead, hack the emulator, put in a temporary change to do this behavior.
Bad news. I tried a little of #1, and we weren't lucky enough for the problem to occur early enough to show the answer.
No worries, so option #2 it is.
Add a change to the emulator that hooks on write, something like this:
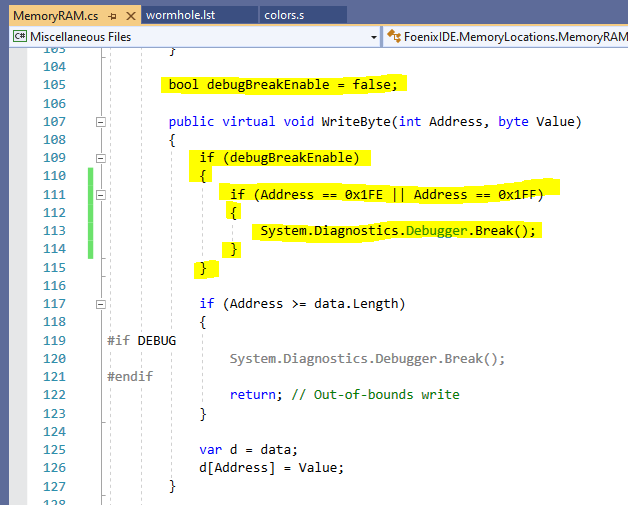
This "poor man's conditional breakpoint" let me track the pattern of pushes and pops to the stack. The process of doing this was a bit troublesome because I'd see different behavior based on whether I had debugger attached or not (terrific!)
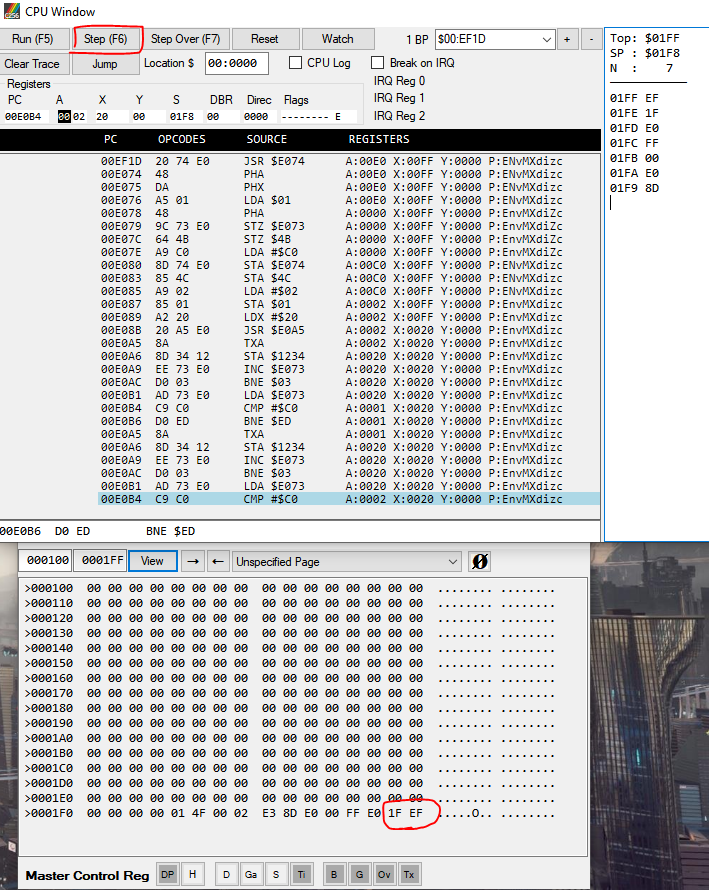
That said, I saw it hit, where a subsequent function call pushed a new return address to the same location. So that points to a return not popping off the stack.
Now that we've confirmed that, the next step is to make sure it is really can do the return in this repro. To do that I look at the code bytes make sure they're really in the binary.
Wait a minute! There's a 0xC0 (CPY) instead of a 0x60 (RTS). The problem isn't just something scrambling the stack, something is overwriting code. One is causing the other. It must be bad code, that is scrambling the stack.
As a lazy effort, I looked in the assembly output for the address that gets scrambled, and there it was.
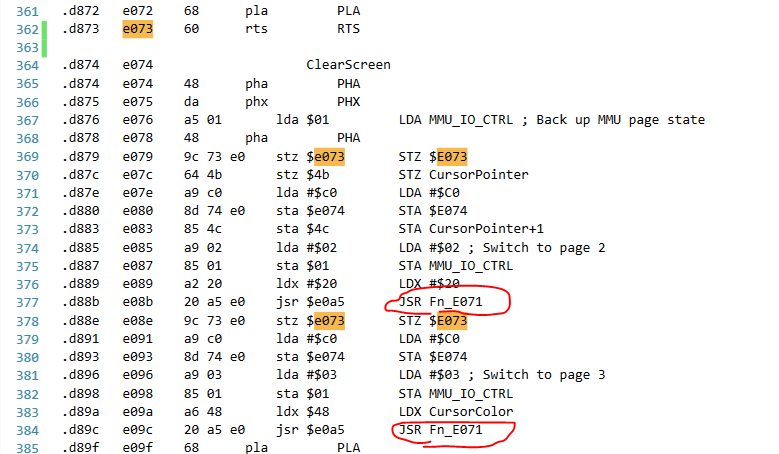
Those STZ and STAs are scrambling the return value and the byte after it, and then I noticed that Fn_E071 would scramble them further, reaching the pattern show in the earlier memory window screenshot.
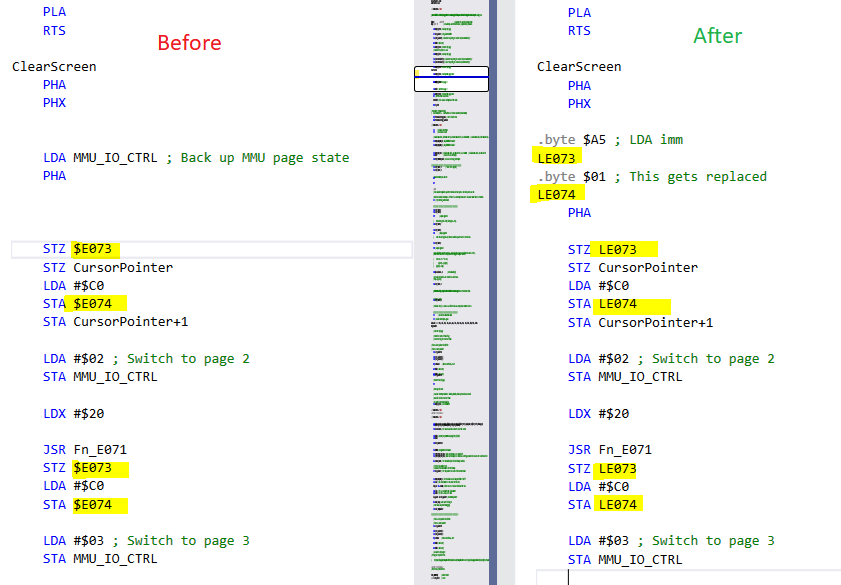
I didn't write this code to be self-modifying like this. I adapted this code from a sample, using some mix of tooling and manual disassembling. Well, there's the problem.
You see, $E074 used to point to data, the original version of this program. However, I inserted code which throws the label off. Because this memory was addressed by absolute address not by a label, inserting code invalidates it.
Correcting the code to key off of labeled:
And running the result
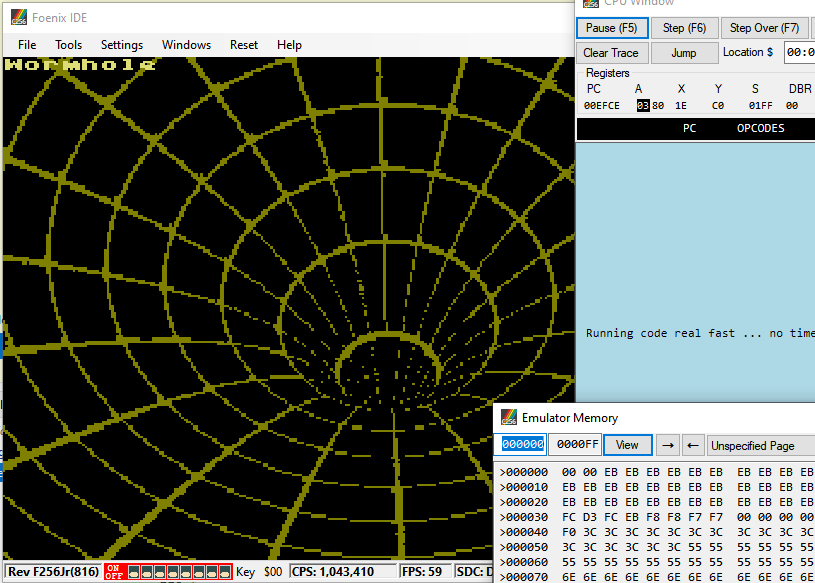
Success, you can see the whole text gets emitted and the rest of the demo runs as expected.
Patching the fix back into the whole application, and testing the whole thing on hardware:
That confirms the change above fixed the problem.
To build this demo, see the repository here. To run the demo, see binary releases here.
📅April 22nd, 2023
Do you remember DirectDraw? The DirectX 5 SDK disc came with a bunch of samples, including one called "Wormhole".
Looks like this:
How it works: despite how the image looks animated, there's no change to the framebuffer data. It's all palette rotation. The sample comes with a bitmap specially chosen so that the colors rotate to produce this 'wormhole' animation.
If you want to try it yourself, load it up from a DirectX 5 SDK disc (it's on some other SDK version discs, as well). Or, you can find it on the Internet Archive here: https://archive.org/details/idx5sdk.
My project: ported this sample to C256 Foenix. (Update: I later also ported it to F256 Foenix.)
This is a language (C to 65816) and platform (Win32+DirectDraw to C256 Foenix + Vicky II) port.
Some of the challenges were:
- Making sure the right bitmap with the right palette gets initialized. See, it's not sufficient to simply read RGB of the original bitmap and emit a new one that looks visually equivalent. The original bitmap's palette needs to be preserved. It contains "dead" colors- colors that aren't referenced by any one pixel as you view it, but are important to the rotation effect. I wrote a tool called BitmapEmbedder to take care of this.
- Betting on how long, in terms of clock, the rotation effect would take to execute. I was bold and put it all in VBLANK handler. Fortunately it fit and I didn't optimize for perf super aggressively. I had no idea whether it would fit. If it didn't, I would've to pull a bunch of it out and synchronize it. And it would be easier to do that at the beginning, before it's all set up. I took the risk at the beginning that it would fit and this paid off.
- Having a loop that needed to be longer than the signed branch distance limit. I could have maybe added a "hop" to get back to the beginning of the loop. Instead I factored out a function for no reason other than to get past the limit. It doesn't make me feel great. Could be something to revisit later.
A bunch of other things worked well. Vicky II has a dedicated bitmap layer that you can cleanly copy to. I say cleanly because it was a lot easier to work with compared to Apple II, and SNES for that matter. There isn't any weird swizzling, interleaving or holes. It was exactly compatible with a DirectDraw surface in terms of indexed color and surface size.
Result looks like: (comparison between the original and the port)
If you aren't familiar with the concept of palette rotation:
Palette rotation is a visual effect made possible by storing image data in a compact way.
You might be familiar with not-very-compact ways to store image data. For each pixel, say, you store a red, green and blue color value. Functionally that works, no worries. But the memory cost- even if each color channel is only two-thirds of a byte, then each pixel will still take up two bytes. Or if each color channel is a byte, you're looking at three bytes then. Or even four if you use alpha. The memory cost can really add up to more than you can afford.
There's a more compact way to store image data. You can store indexed color instead. For each pixel, store a key. The key is only 1 byte, not 4. It's a number from 0 to 255. When the computer displays the image on the screen, it will use that key to look up into a palette, or table of colors. In a way, this limits image quality, since you can only have an image with a low total number of colors (256). But you save a lot of memory. After all, each pixel takes up only one byte.
There are different configurations of key size affecting how many colors you can use at a time. You could sacrifice image quality to optimize for memory even more. Like anything there are tradeoffs. Having a key be one byte is a popular choice though, and this is supported on Vicky II.
Ordinarily, it'd cost a lot of perf to implement palette lookups yourself in your software. "For each pixel, look up into the palette, assign a color..." It's be so slow. Fortunately, indexed color is an industry-recognized idea that has built-in hardware acceleration on a ton of platforms, including on Vicky II. That's where the benefit really shines, so you don't have to worry.
Anyway, as you see with indexed color, there's indirection. Change one entry in the palette, a simple one-byte change, and it could affect half your image or more. Because of the indirection used with indexed color, an effective way to animate things can be to not animate the image data at all, but to simply make a small change to the palette. The palette has way fewer bytes of data, yet the capacity to change how the whole image looks.
Palette rotation can also be called color cycling. There are some beautiful artworks using color cycling to convey water, snow, or other effects. For example, see this snow effect from this demo page (not my page):
The grid in the lower right shows the palette being changed.
Or this one, with rain:
The Wormhole sample uses the idea of palette rotation to achieve an animation effect. It only copies the original bitmap data once on application start. It never touches it again.
Every VBLANK handler, it only updates the palette. And although it does a lot of manipulations to the palette-- there's four loops, iterating over various parts of it, copying entries around-- it can still be way less expensive than an alternative way of animating things- iterating over every pixel in the bitmap. This way, you can exploit this compactness in the image format to get a performance benefit too.
Source code available here:
https://github.com/clandrew/wormhole/blob/main/vickyii/wormhole.s
📅February 17th, 2023
Played with this a bit recently. I'm saving my build for later. To download this build of SerenityOS project, visit here:
Download link (180 MB) - SerenityOS_2_16_2023_43f98ac.zip
To use the provided launcher, QEMU emulator is required. To download QEMU for Windows, visit here:
https://www.qemu.org/download/#windows.
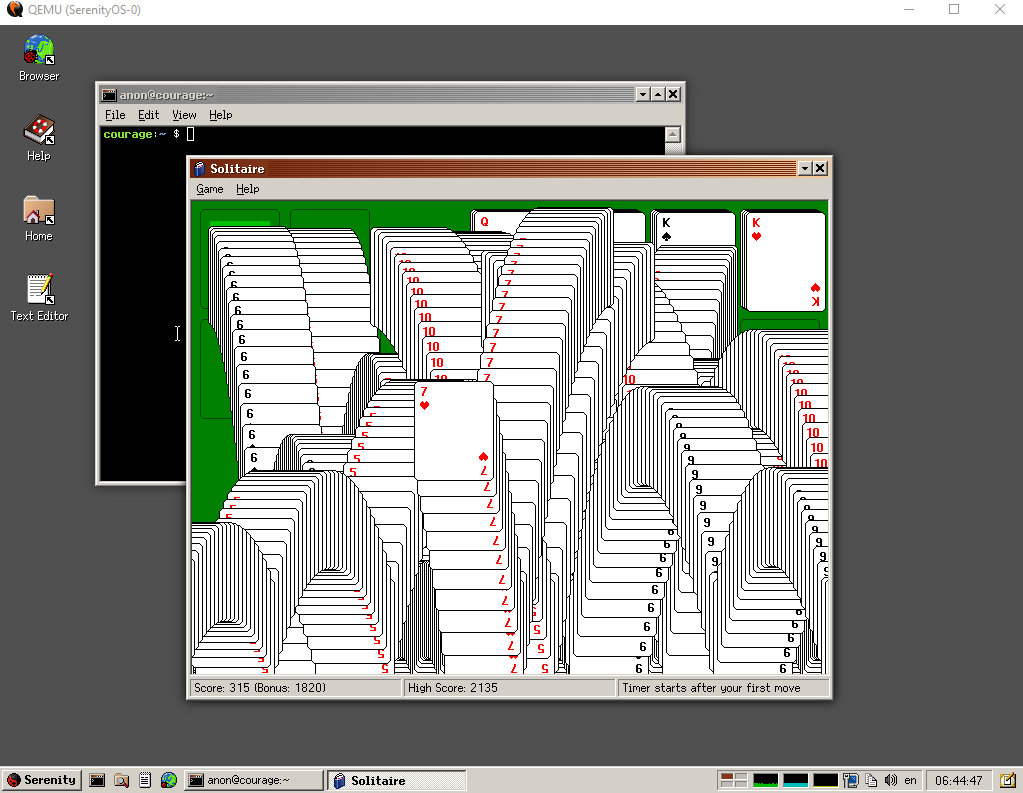
About this operating system: this is an open-source operating system created from the ground up by a group of hobbyists. Under the hood, it's similar to Unix. Cosmetically, it looks a lot like Windows 95 though.
Build contents:
- _disk_image (1.98 GB, compresses really well)
- Kernel (54.1 MB)
- Launch.bat (2 KB)
- LICENSE (2 KB)
- Prekernel (47 KB)
- README.txt (1 KB)
The Launch.bat script is the same as what as produced from SerenityOS's "launch the operating system in QEMU emulator" script, with one change. I removed
hostfwd=tcp:127.0.0.1:2222-10.0.2.15:22because it conflicts with some Windows TCP exclusion range. You can add it back if you don't use anything that conflicts.
For more information about SerenityOS, visit https://serenityos.org.
For source code, visit https://github.com/SerenityOS/serenity.
For the project's license file, see LICENSE.TXT included with the build, or view it at
https://raw.githubusercontent.com/SerenityOS/serenity/master/LICENSE.
This is an x86-64 build created off of commit hash 43f98ac6e1eb913846980226b2524a4b419c6183 on 2/12/2023.
The build was produced in a WSL environment using Ubuntu 22.04.1 LTS distribution.
Today most people use SerenityOS by running it in an emulator. From what I saw, that's the road better traveled. More specifically they run it in QEMU emulator, emulating a very low spec x64 based computer. I did see there's a subgroup of their community getting it to run on hardware. It seems like they wrote the software stack first and then tried to find hardware to fit it, doing things in that order.