


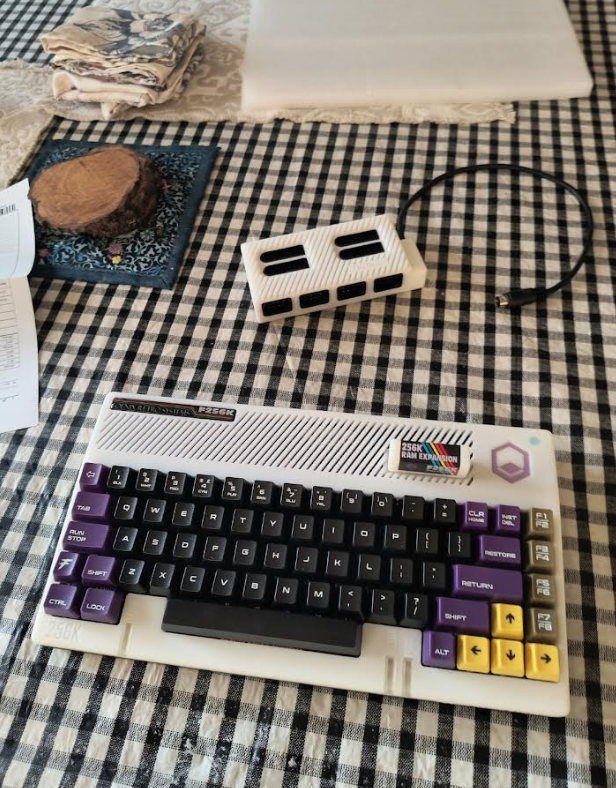
I debugged this problem. I'm writing up the process so I remember what happened in case I have to go back to it, and for if you're running into a similar problem and you're looking for ideas.
Symptom: Application starts, runs a little, then hangs mysteriously on the F256k.
First I narrowed down the repro. The application was originally written to do a bunch of things. I deleted a bunch of functionality to the point where it still reproed when simply trying to print text to the screen.
Step 1. Reproduce the problem on emulator
The repro was reliable on hardware, no issues there.
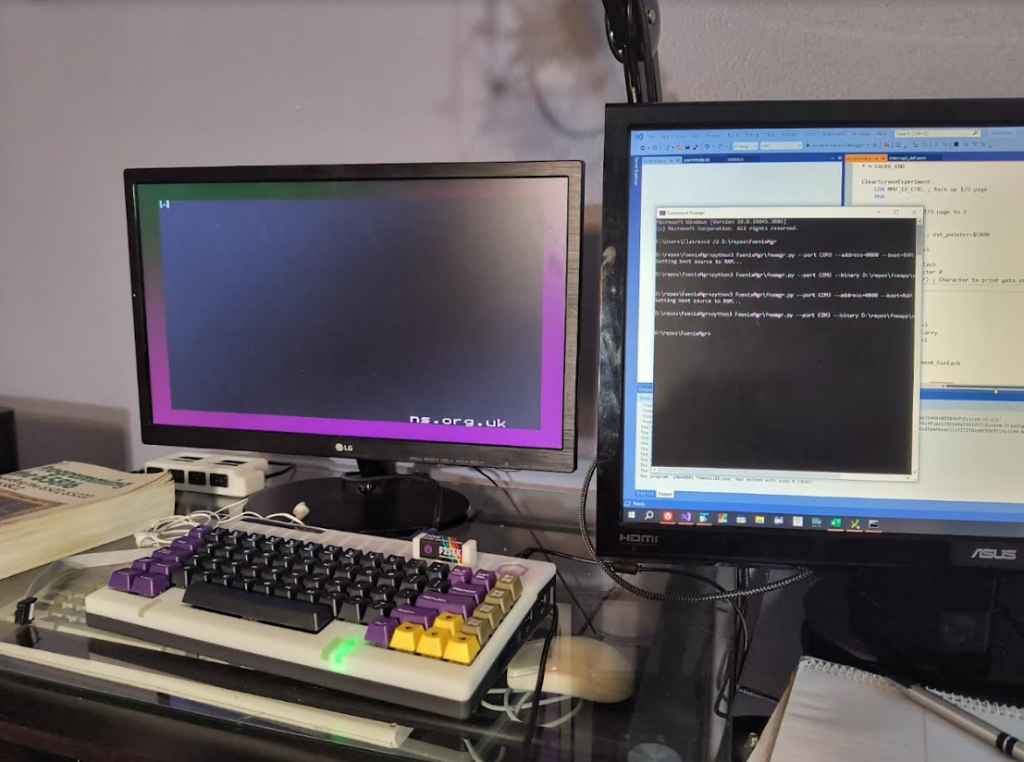
It's supposed to print the word 'Wormhole'. It stops at the letter 'W'.
What next?
How to get debuggability. Remote debugging F256 is on some people's minds and it's in the realm of possibility. There's a wired transport to a host computer, and allegedly a toolchain out there that could be made compatible with a bit of work. It's just not an established path at the time of this writing.
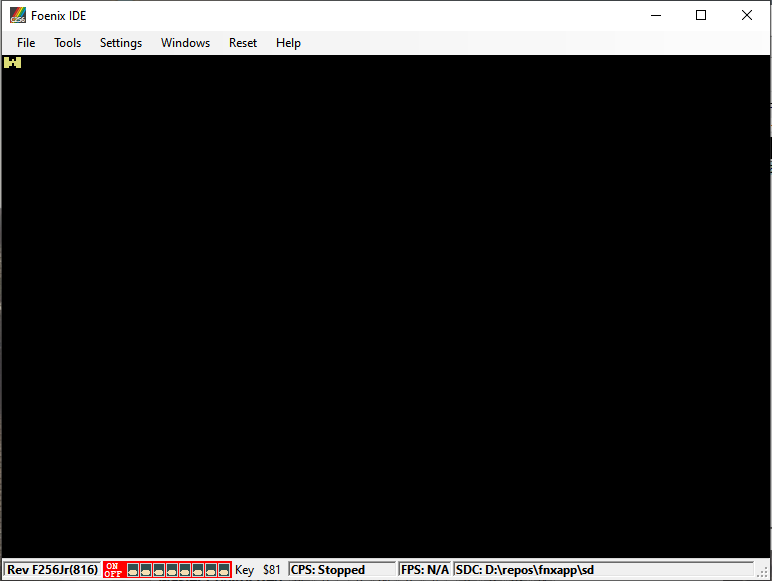
But what about the emulator? Fortunately, the Foenix emulator has a debugger built in. And while it's true a debugger is not strictly needed at all, it makes investigating a lot easier. So let's try running with the emulator.
To get the program compatible with emulator, I made a couple changes:
- Generate a .hex file, since the emulator knows how to load those and not 'bin'.
- Fix up compile offsets so that the program copes from being loaded at offset 0, not offset 0x800. Since with binary files you can specify where you want it loaded; with hex files you can't.
- Ideally, refactor things so the same source can be built in either of the two modes.
- Update the emulator to have compatibility with the 65816-based chip with F256, instead of just 6502, because that's the chip my unit has. This might not be strictly needed since my application code was all 6502-based at the time and runs in emulation mode, but it couldn't hurt to make sure I'm really comparing apples to apples and using an accurate emulation path. Plus it's support I would need later. The commit for this is here.
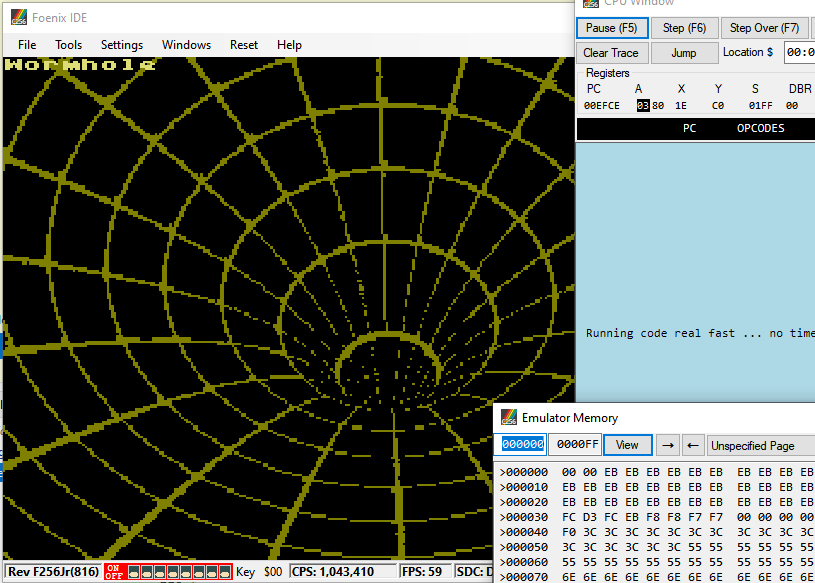
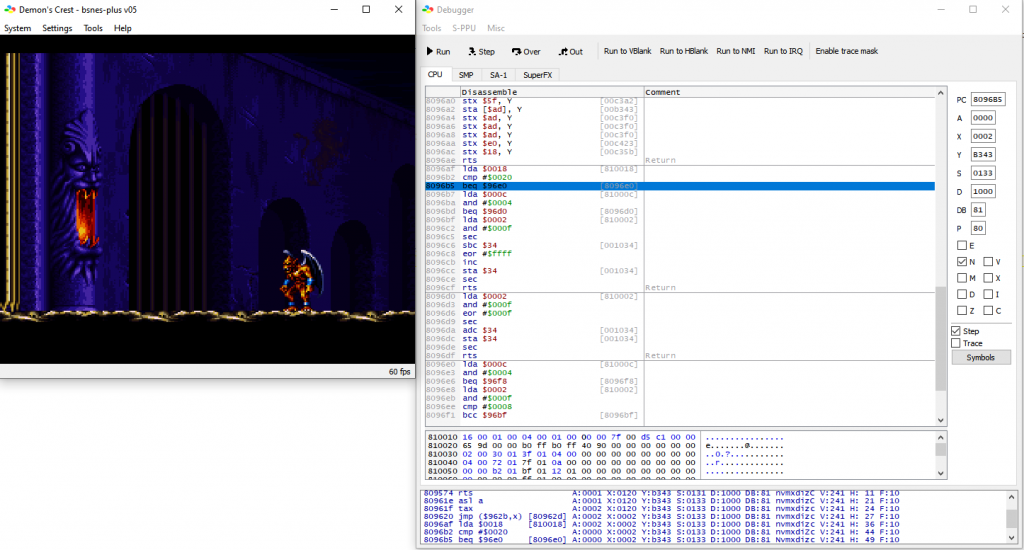
After making the above changes, the repro works on emulator:
Step 2. What kind of hang is it?
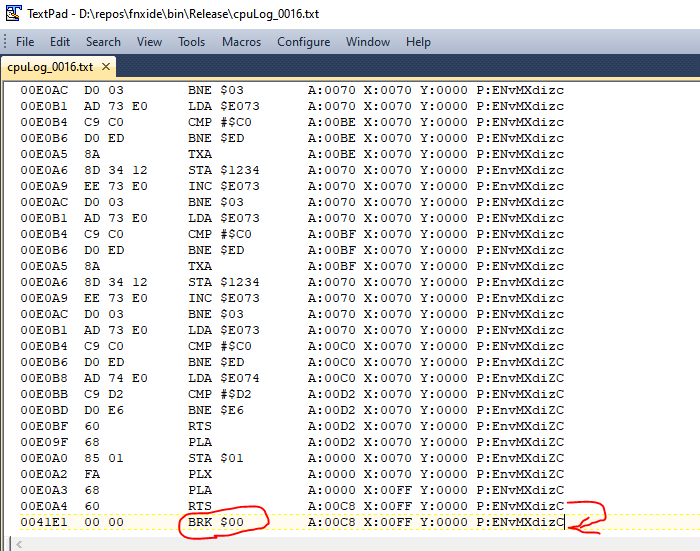
After running in the emulator, this was easy to see: it was a hang due to hitting a BRK. Not a spin, not a deadlock, not an invalid instruction. Simple enough.
The location of the BRK itself it's saying is zero, not where my appcode was. So it's unclear how execution landed there. For a BRK on this emulator, I don't know that I necessarily trust the right program counter to be reported. It's enough to know that it hit a BRK though.
This is a case where time-travel debugging would immediately tell you the answer. Unfortunately, we don't have time-travel debugging. Fortunately, we have the next best thing: transcript debugging in the emulator with support that I added in my fork here.
Step 3. Working backwards
Re-launch the application with CPU log.
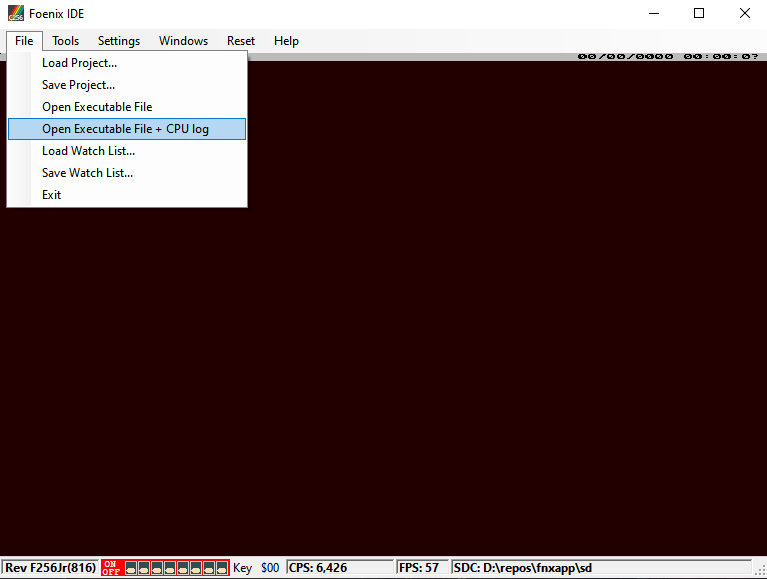
If I have to debug a hang I always hope it's a hang that halts the CPU. In this case where CPU logging is getting used, it's nice and convenient that the transcript will simply end when the program hangs. No need to guesstimate when to end it and sift through a bunch of noise.
And we're in luck today since BRK halts the CPU.
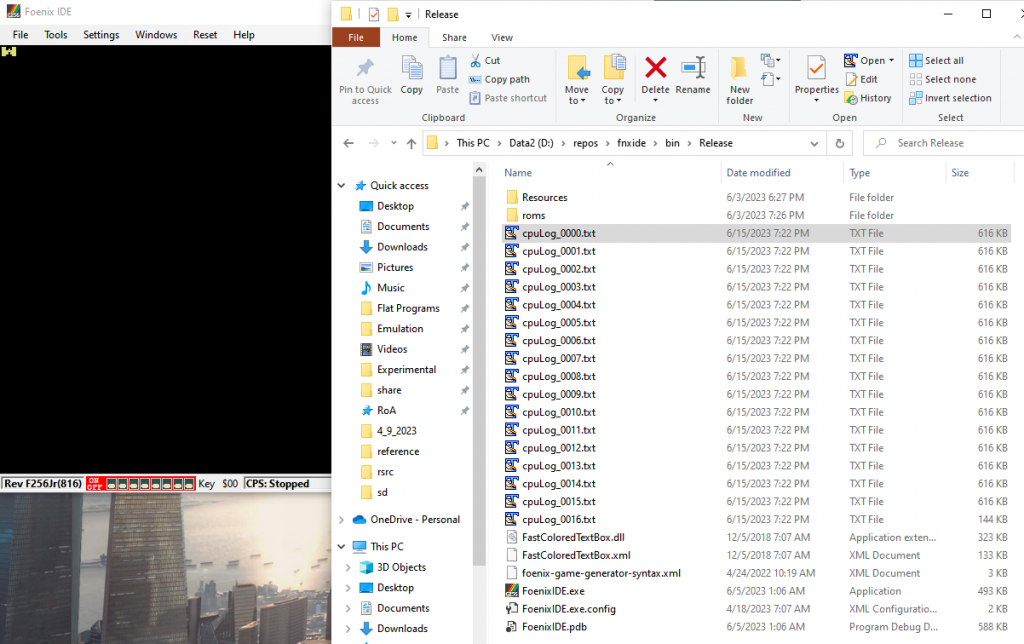
So after it halts, stop the program, take the transcript files that got emitted and open them.
Looking in the transcripts, everything looked mostly looked normal. What was curious is the hang happened quite early, before the things I considered more "risky" were ever executed. Before calls to our interrupt handler. Before even enabling interrupts. Before any changes to/from native and emulation mode. None of the usual suspects.
In the transcript, the 'what' it was doing made sense, but not the 'why'. There was some code that looked correctly executed. We're inside a function. That function returns. The place it returns to is not code, it's not really anything.
Some kind of stack corruption? Since the transcript isn't a full state of the machine, we don't know the stack. It's possible.
To find out more, let's compare the transcript to the assembly result.
Why use the assembly result, not source code? Because the assembly result shows code bytes and locations, which is super useful for this category of problem.
Matching up offset .e0a4 with what immediately came before the BRK, we see that the problem happens when returning from the function ClearScreen.
In the program there's only 1 call of ClearScreen, and that's from Main. That call is supposed to have pushed the return value on the stack, and we jump there.
For some reason, instead of returning up to 0x EF1F, the thing after ClearScreen's callsite, we return up to 0x41E1. That must mean something on the stack was overwritten.
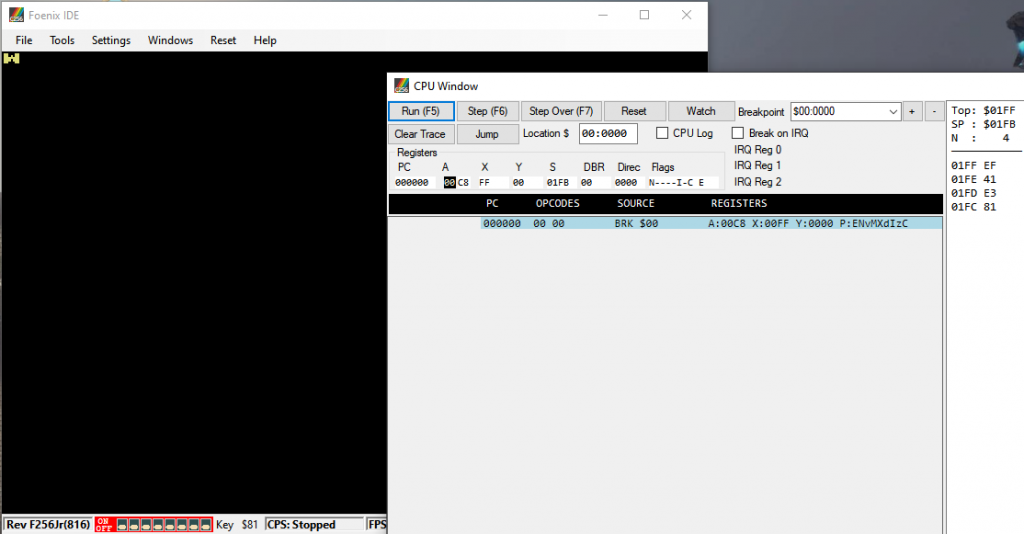
Restarting the program, we can break a little earlier, stepping one instruction into the call to ClearScreen. It looks like this:
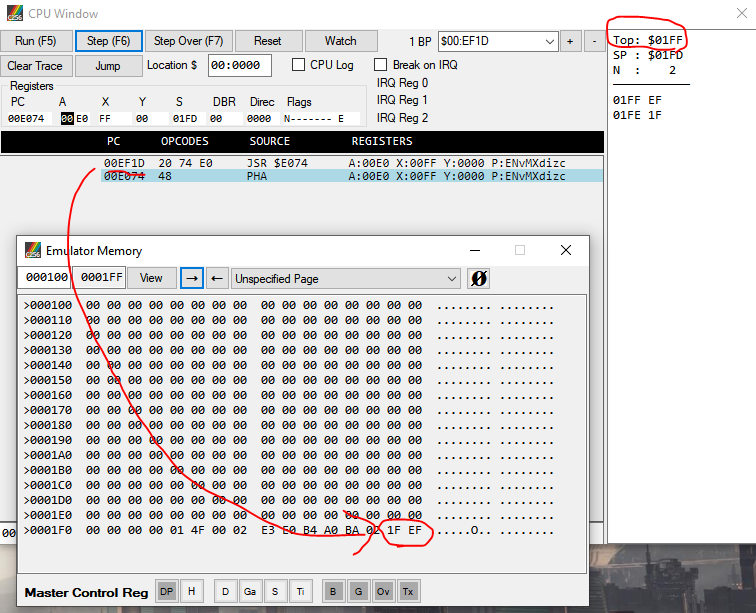
You can see:
- "Top: $01FF" means the top of the stack is at that location, and you can see the current SP, decremented, printed below.
- Looking at that location in the Emulator Memory window, it shows 0xEF1F.
- So the address-to-return-to is 0xEF1F. The bytes are swapped for endianness on this platform
Well that return-address makes sense. It's +2 from the call site which was 0xEF1D.
The value pushed to the stack is always supposed to be +2. In other words, it's one less than the next instruction. See this reference.
Something must scramble, or over-write this value later. What is it?
There are two options for finding out.
- Single step in the debugger a few instructions. If the scrambling occurred toward the beginning of the function, this would catch it quickly.
- Set break-on-write in the debugger. At the time of writing this, the debugger doesn't support memory breakpoints. So instead, hack the emulator, put in a temporary change to do this behavior.
Bad news. I tried a little of #1, and we weren't lucky enough for the problem to occur early enough to show the answer.
No worries, so option #2 it is.
Add a change to the emulator that hooks on write, something like this:
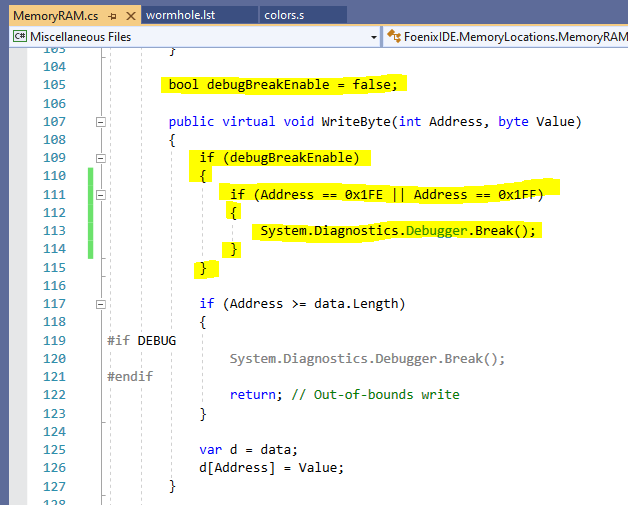
This "poor man's conditional breakpoint" let me track the pattern of pushes and pops to the stack. The process of doing this was a bit troublesome because I'd see different behavior based on whether I had debugger attached or not (terrific!)
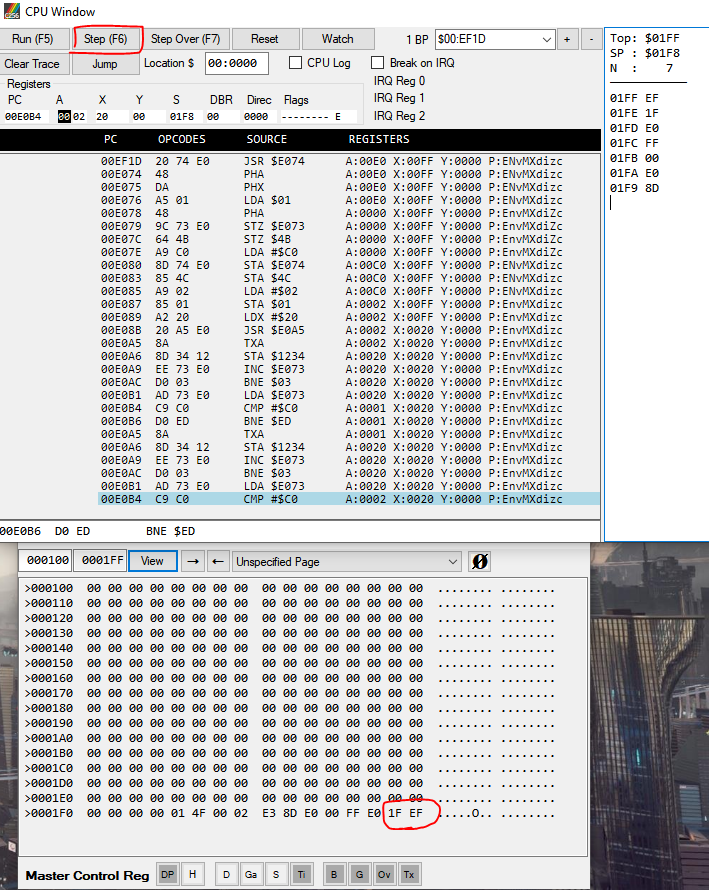
That said, I saw it hit, where a subsequent function call pushed a new return address to the same location. So that points to a return not popping off the stack.
Now that we've confirmed that, the next step is to make sure it is really can do the return in this repro. To do that I look at the code bytes make sure they're really in the binary.
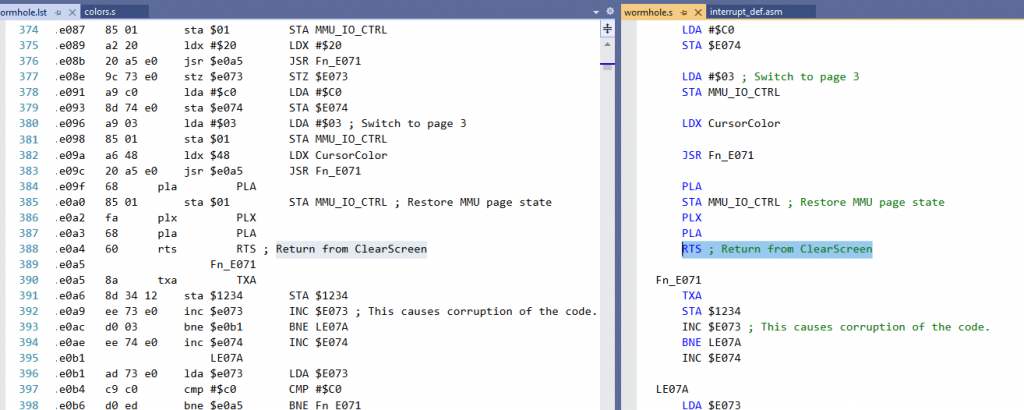
Wait a minute! There's a 0xC0 (CPY) instead of a 0x60 (RTS). The problem isn't just something scrambling the stack, something is overwriting code. One is causing the other. It must be bad code, that is scrambling the stack.
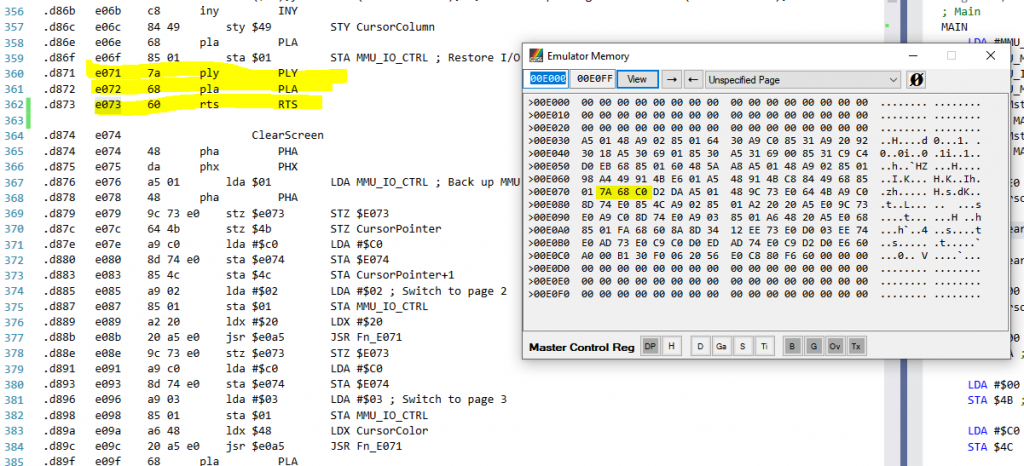
As a lazy effort, I looked in the assembly output for the address that gets scrambled, and there it was.
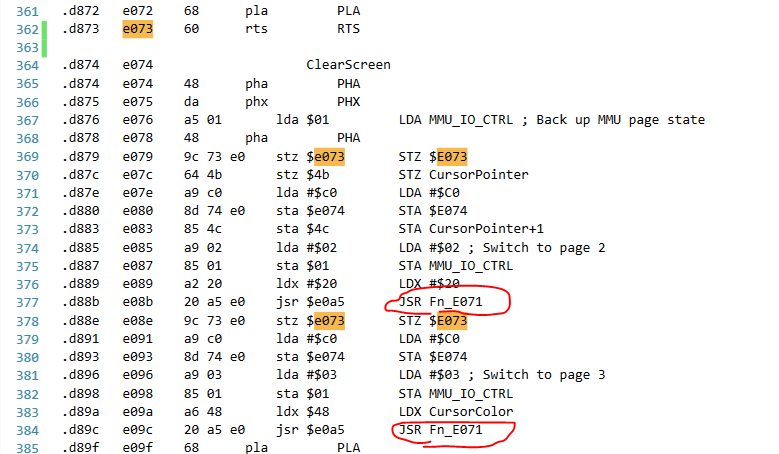
Those STZ and STAs are scrambling the return value and the byte after it, and then I noticed that Fn_E071 would scramble them further, reaching the pattern show in the earlier memory window screenshot.
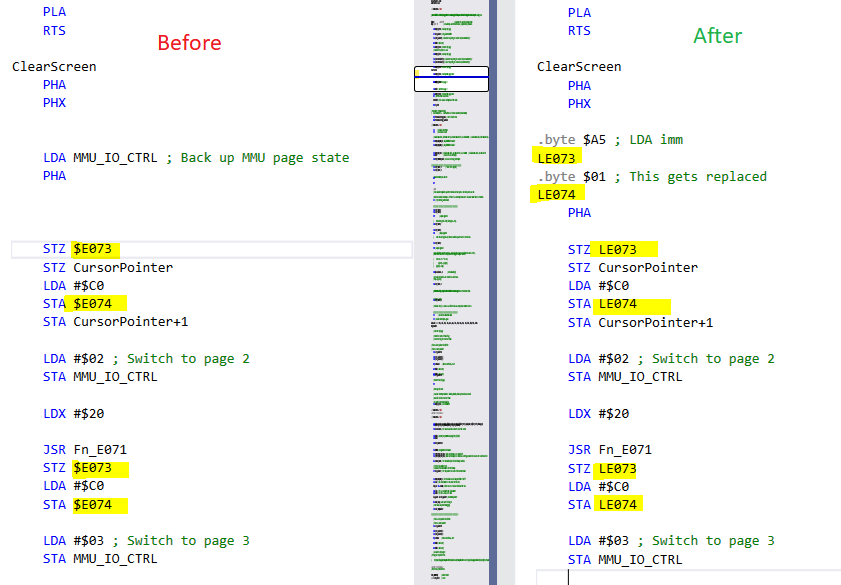
I didn't write this code to be self-modifying like this. I adapted this code from a sample, using some mix of tooling and manual disassembling. Well, there's the problem.
You see, $E074 used to point to data, the original version of this program. However, I inserted code which throws the label off. Because this memory was addressed by absolute address not by a label, inserting code invalidates it.
Correcting the code to key off of labeled:
And running the result
Success, you can see the whole text gets emitted and the rest of the demo runs as expected.
Patching the fix back into the whole application, and testing the whole thing on hardware:
That confirms the change above fixed the problem.
To build this demo, see the repository here. To run the demo, see binary releases here.
Do you remember DirectDraw? The DirectX 5 SDK disc came with a bunch of samples, including one called "Wormhole".
Looks like this:
How it works: despite how the image looks animated, there's no change to the framebuffer data. It's all palette rotation. The sample comes with a bitmap specially chosen so that the colors rotate to produce this 'wormhole' animation.
If you want to try it yourself, load it up from a DirectX 5 SDK disc (it's on some other SDK version discs, as well). Or, you can find it on the Internet Archive here: https://archive.org/details/idx5sdk.
My project: ported this sample to C256 Foenix. (Update: I later also ported it to F256 Foenix.)
This is a language (C to 65816) and platform (Win32+DirectDraw to C256 Foenix + Vicky II) port.
Some of the challenges were:
- Making sure the right bitmap with the right palette gets initialized. See, it's not sufficient to simply read RGB of the original bitmap and emit a new one that looks visually equivalent. The original bitmap's palette needs to be preserved. It contains "dead" colors- colors that aren't referenced by any one pixel as you view it, but are important to the rotation effect. I wrote a tool called BitmapEmbedder to take care of this.
- Betting on how long, in terms of clock, the rotation effect would take to execute. I was bold and put it all in VBLANK handler. Fortunately it fit and I didn't optimize for perf super aggressively. I had no idea whether it would fit. If it didn't, I would've to pull a bunch of it out and synchronize it. And it would be easier to do that at the beginning, before it's all set up. I took the risk at the beginning that it would fit and this paid off.
- Having a loop that needed to be longer than the signed branch distance limit. I could have maybe added a "hop" to get back to the beginning of the loop. Instead I factored out a function for no reason other than to get past the limit. It doesn't make me feel great. Could be something to revisit later.
A bunch of other things worked well. Vicky II has a dedicated bitmap layer that you can cleanly copy to. I say cleanly because it was a lot easier to work with compared to Apple II, and SNES for that matter. There isn't any weird swizzling, interleaving or holes. It was exactly compatible with a DirectDraw surface in terms of indexed color and surface size.
Result looks like: (comparison between the original and the port)
If you aren't familiar with the concept of palette rotation:
Palette rotation is a visual effect made possible by storing image data in a compact way.
You might be familiar with not-very-compact ways to store image data. For each pixel, say, you store a red, green and blue color value. Functionally that works, no worries. But the memory cost- even if each color channel is only two-thirds of a byte, then each pixel will still take up two bytes. Or if each color channel is a byte, you're looking at three bytes then. Or even four if you use alpha. The memory cost can really add up to more than you can afford.
There's a more compact way to store image data. You can store indexed color instead. For each pixel, store a key. The key is only 1 byte, not 4. It's a number from 0 to 255. When the computer displays the image on the screen, it will use that key to look up into a palette, or table of colors. In a way, this limits image quality, since you can only have an image with a low total number of colors (256). But you save a lot of memory. After all, each pixel takes up only one byte.
There are different configurations of key size affecting how many colors you can use at a time. You could sacrifice image quality to optimize for memory even more. Like anything there are tradeoffs. Having a key be one byte is a popular choice though, and this is supported on Vicky II.
Ordinarily, it'd cost a lot of perf to implement palette lookups yourself in your software code. "For each pixel, look up into the palette, assign a color..." It's be so slow. Fortunately, indexed color is an industry-recognized idea that has built-in hardware acceleration on a ton of platforms, including on Vicky II. That's where the benefit really shines, so you don't have to worry.
Anyway, as you see with indexed color, there's indirection. Change one entry in the palette, a simple one-byte change, and it could affect half your image or more. Because of the indirection used with indexed color, an effective way to animate things can be to not animate the image data at all, but to simply make a small change to the palette. The palette has way fewer bytes of data, yet the capacity to change how the whole image looks.
Palette rotation can also be called color cycling. There are some beautiful artworks using color cycling to convey water, snow, or other effects. For example, see this snow effect from this demo page (not my page):
The grid in the lower right shows the palette being changed.
Or this one, with rain:
The Wormhole sample uses the idea of palette rotation to achieve an animation effect. It only copies the original bitmap data once on application start. It never touches it again.
Every VBLANK handler, it only updates the palette. And although it does a lot of manipulations to the palette-- there's four loops, iterating over various parts of it, copying entries around-- it can still be way less expensive than an alternative way of animating things- iterating over every pixel in the bitmap. This way, you can exploit this compactness in the image format to get a performance benefit too.
Source code available here:
https://github.com/clandrew/wormhole/blob/main/vickyii/wormhole.s
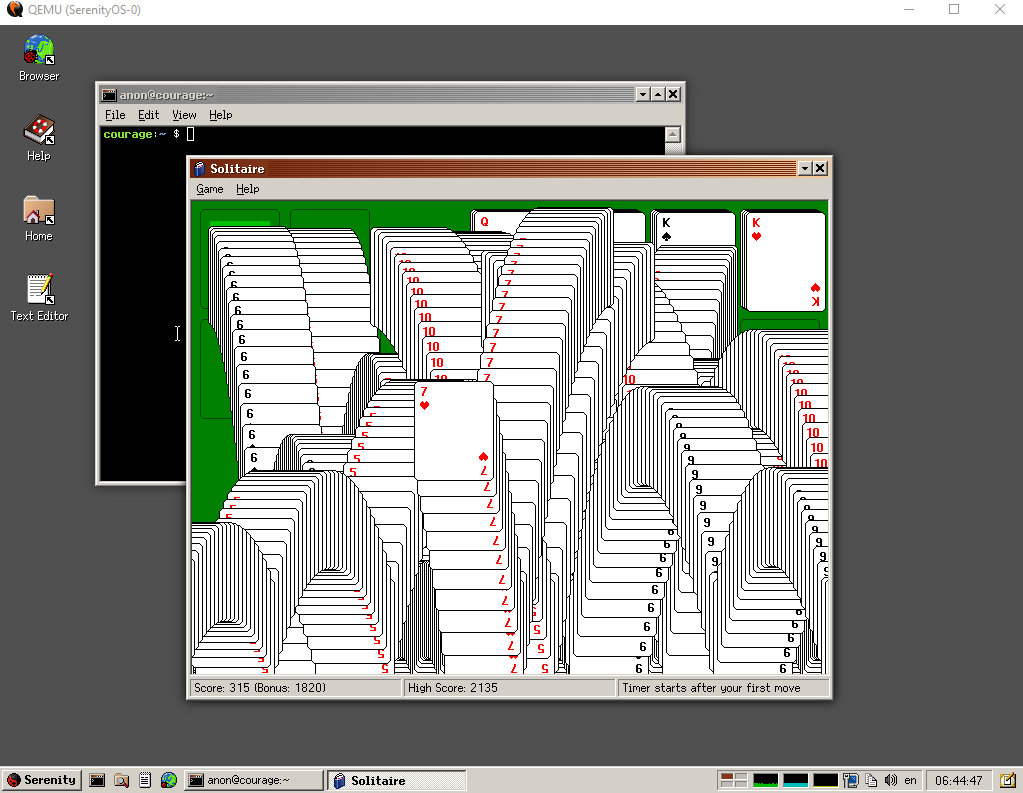
Played with this a bit recently. I saved my build for later. To download this build of SerenityOS project, visit here:
Download link (180 MB) - SerenityOS_2_16_2023_43f98ac.zip
To use the provided launcher, QEMU emulator is required. To download QEMU for Windows, visit here:
https://www.qemu.org/download/#windows.
About this operating system: this is an open-source operating system created by a group of hobbyists. Under the hood, it's similar to Unix. At the user interface level, it looks a lot like Windows 95 though.
Build contents:
- _disk_image (1.98 GB, compresses really well)
- Kernel (54.1 MB)
- Launch.bat (2 KB)
- LICENSE (2 KB)
- Prekernel (47 KB)
- README.txt (1 KB)
The Launch.bat script is the same as what as produced from SerenityOS's "launch the operating system in QEMU emulator" script, with one change. I removed
hostfwd=tcp:127.0.0.1:2222-10.0.2.15:22because it conflicts with some Windows TCP exclusion range. You can add it back if you don't use anything that conflicts.
For more information about SerenityOS, visit https://serenityos.org.
For source code, visit https://github.com/SerenityOS/serenity.
For the project's license file, see LICENSE.TXT included with the build, or view it at
https://raw.githubusercontent.com/SerenityOS/serenity/master/LICENSE.
This is an x86-64 build created off of commit hash 43f98ac6e1eb913846980226b2524a4b419c6183 on 2/12/2023.
The build was produced in a WSL environment using Ubuntu 22.04.1 LTS distribution.
Today most people use SerenityOS by running it in an emulator. More specifically they run it in QEMU emulator, emulating a very low spec x64 based computer. There is a subgroup of people investing running it natively on a computer not on an emulator. You can find the discussion group for this on the #bare-metal channel of the SerenityOS Discord server.
Consider this 65816 program
.cpu "65816"

PUTS = $00101C
PUTC = $001018
* = $00FFFC
RESET   .word <>START

* = $002000
START   CLC                         ; Make sure we're native mode
        XCE

        REP #$30
        .al
        .xl
        JSR MSG1

        SEP #$30  ; Set 8bit axy
DIV

;;;;;;;;;;;;;;;;;;;;;;;;;;;;;;;;;;;;;;;;;;;;;;;;;;;;;;;;;;;;;
; Value      ; 8bit interpretation    ; 16bit interpretation
;;;;;;;;;;;;;;;;;;;;;;;;;;;;;;;;;;;;;;;;;;;;;;;;;;;;;;;;;;;;;
;            ;                        ;
.byte $A9    ; LDA #$3A               ; LDA #$3A3A
.byte $3A    ;                        ;
.byte $3A    ; DEC A                  ;
;            ;                        ;
.byte $29    ; AND #$39               ; AND #$3A39
.byte $39    ;                        ;
;            ;                        ;
.byte $3A    ; DEC A                  ;
;            ;                        ;
.byte $29    ; AND #$38               ; AND #$2038
.byte $38    ;                        ;
;            ;                        ;
.byte $20    ; JSR $20EA              ;
.byte $EA    ;                        ; NOP
;            ;                        ;
.byte $20    ;                        ; JSR $20E0
;            ;                        ;
.byte $E0    ;
.byte $20    ;

        TAX
        JSR CLRB
        JSL PUTS
        JSR MSG2

DONE    NOP         ; Spin
        BRA DONE

* = $002038
MODE16 .null "16"
PRE   .null "This is in "
SUF   .null "-bit mode.     "

CLRB    LDA #$0000
        PHA
        PLB
        PLB
        RTS

MSG1    JSR CLRB
        LDX #<>PRE
        JSL PUTS
        RTS

MSG2    JSR CLRB
        LDX #<>SUF
        JSL PUTS
        RTS

* = $0020E0
        RTS

* = $0020EA
        JSL PUTC
        REP #$30
        .al
        .xl
        JSR MSG2
        JSR MSG1
        JMP DIV
for C256 Foenix, assembled with 64tass.
When run, the output looks like
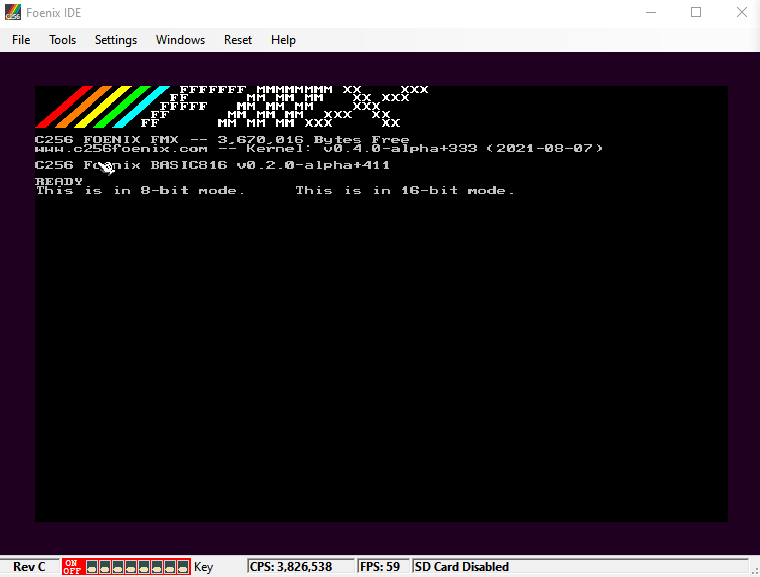
Explanation: the part of the program labeled 'DIV' will run twice, under different interpretations. First in 8bit mode, then in 16bit mode, for displaying the '8' and '16' printable characters respectively.
Normally code in 8bit is garbage when interpreted in 16bit mode and vice-versa. These ops were specially chosen so that they are valid in both with different behavior
Because it's not possible to express the reinterpretation idea in an assembly language, this just dumps the code bytes in the middle of the program and there's 2 columns of commented-out language explaining what the bytes do. The 2 columns are one for 8bit and one for 16bit.
I wrote it as a silly test. It's a test for the debugger. It's to see how it might display in a 'source-style' debugger. When running it I pass the debugger my source file listing.
It goes... not great
'Transcript debugging' described in this earlier post fixes it, it's 100% coherent and matches the source.
So a good vote to use that kind of debugger for this type of thing.
Full source code available here:
Summary: I'm making a case for a certain type of debugger.
More detail below.
A couple times people trying to get into ROM patching ask me what tool I use. I'll answer, although it's not the popular answer. It takes some getting used to because of type of debugging it is and for other reasons.
What I use for most of my patching stuff is Geiger's SNES debugger. It's a special build of Snes9x with a debugger bolted on.
Looks like this
The game, main debugger interface, and memory view are in different windows. You press the 'Breakpoints' button to get a pop-up dialog for setting those. Looks very Win32 ish.
Why not for everyone?
When I first started looking into debugging SNES it was a while ago, this was one of the best options available.
Since then, the world has moved on.
Despite the age of the SNES today, there is a lot of information out there sourced by fans and tools under active development.
Today, there are SNES debuggers that
- have larger feature sets
- have been tested more thoroughly to weed out issues
- have interfaces that suit newer UI/UX paradigms
- are actively developed
- are open-source and so are easy to extend
The debugger has some 'personality traits' I've gotten used to working around. Here's a list of what they are in case you run into them.
Issue: Breakpoints don't hit after certain operations (e.g., save state load)
Workaround: Re-open the breakpoint window, and click OK.
Issue: Step Out doesn't step out to the expected place
Workaround: Don't rely on Step Out for function calls that straddle any interrupts.
Issue: 'Show Hex' (memory) window shows blank ROM on 1st open
Workaround: Choose something (e.g., RAM) 'viewing' dropdown then go back to ROM.
Issue: Emulator crash if you scroll too far down in the memory window
Workaround: Don't use invalid ranges. Don't try to scroll past the end of the range.
Issue: Can not view CGRAM or OAM
Workaround: Use a different debugger.
Issue: Can not view DBR or PBR
Workaround: Edit some code to push them (PHB/PHK) then PLA.
Software
The debugger isn't under active development anymore so things like the above list are what they are. I contacted Geiger asking for the source code. He responded wishing me well, and wouldn't give it to me for various reasons which is his perogative.
None of these were bad enough to block me, it's been alright.
They also weren't severe enough to be motivating to go in and fix them in this closed-source program.
Why I use it
Despite the above things, I still use it for a few reasons.
- Habit. I know my way around it
- The most complicated parts of what I need to do aren't actually through a debugger, (e.g., 'special diffing' of memory dumps), and a debugger could never do as good a job as flexible-function code.
- Transcript-style debugging.
The biggest one is transcript debugging.
For transcript-style debugging see explanation below.
Transcript-style debugging
For ROM patching projects where the patch is a small targeted surface area, generally speaking you're not trying to recover source code.
Recovering source code so that you can work in it is something you can do if you really want. You can do it if it makes you happy. But it's not always crucial. It can even be a distraction. Be it in an assembly language or a higher-level language like C/C++, recovering source code can be unnecessary for your goal of a targeted change in behavior and can make the task way less efficient.
To get better at this kind of reverse-engineering task, and this is hard for a lot of people to hear-- you need to fall out of love with source code written in programming languages. This includes source-level debugging, it includes expressions of flow control, and this includes source code written in assembly languages.
Below is an example of a debugger listing not using source-level debugging, and using transcript-style debugging instead:
$80/BC3A 20 B0 C1    JSR $C1B0  [$80:C1B0]   A:0000 X:00A9 Y:0005 P:envmXdizc

$80/C1B0 64 6F       STZ $6F    [$00:006F]   A:0000 X:00A9 Y:0005 P:envmXdizc
$80/C1B2 A5 6C       LDA $6C    [$00:006C]   A:0000 X:00A9 Y:0005 P:envmXdizc
$80/C1B4 0A          ASL A                   A:3640 X:00A9 Y:0005 P:envmXdizc
$80/C1B5 88          DEY                     A:6C80 X:00A9 Y:0005 P:envmXdizc
$80/C1B6 F0 13       BEQ $13    [$C1CB]      A:6C80 X:00A9 Y:0004 P:envmXdizc
$80/C1B8 90 38       BCC $38    [$C1F2]      A:6C80 X:00A9 Y:0004 P:envmXdizc
$80/C1F2 86 00       STX $00    [$00:0000]   A:6C80 X:00A9 Y:0004 P:envmXdizc
$80/C1F4 A2 02       LDX #$02                A:6C80 X:00A9 Y:0004 P:envmXdizc
$80/C1F6 0A          ASL A                   A:6C80 X:0002 Y:0004 P:envmXdizc
$80/C1F7 88          DEY                     A:D900 X:0002 Y:0004 P:eNvmXdizc
$80/C1F8 F0 20       BEQ $20    [$C21A]      A:D900 X:0002 Y:0003 P:envmXdizc
$80/C1FA E8          INX                     A:D900 X:0002 Y:0003 P:envmXdizc
$80/C1FB 90 F9       BCC $F9    [$C1F6]      A:D900 X:0003 Y:0003 P:envmXdizc
$80/C1F6 0A          ASL A                   A:D900 X:0003 Y:0003 P:envmXdizc
$80/C1F7 88          DEY                     A:B200 X:0003 Y:0003 P:eNvmXdizC
$80/C1F8 F0 20       BEQ $20    [$C21A]      A:B200 X:0003 Y:0002 P:envmXdizC
"But isn't this source code in assembly language?" I heard this question before. I think this confusion comes from people who haven't done much forward engineering with assembly languages yet, forget reverse engineering.
The above is not source code, it's a debugger transcript.
Again, it's not source code, it's printout of what got executed, one instruction at a time.
Dead giveaways that it's not source code
- Every line starts with an address
- Every line ends with register state
- There's a function call and then the stepped-into body immediately after. Not proper for source code
- Some instructions are repeated, like $80/C1F6, $80/C1F7, $80/C1F8. This is a loop
Thinking it's source code is pretty uncharitable to the readability of source code, which usually uses more identifiers and comments and labels and stuff than this example has.
The transcript looks different from source code, and transcript debugging is different from source style debugging.
How is transcript debugging different?
Now that we know what transcripts are: transcript-style debugging is different from source-style, or traditional debugging.
See an example of source-style debugging, with No$sns:
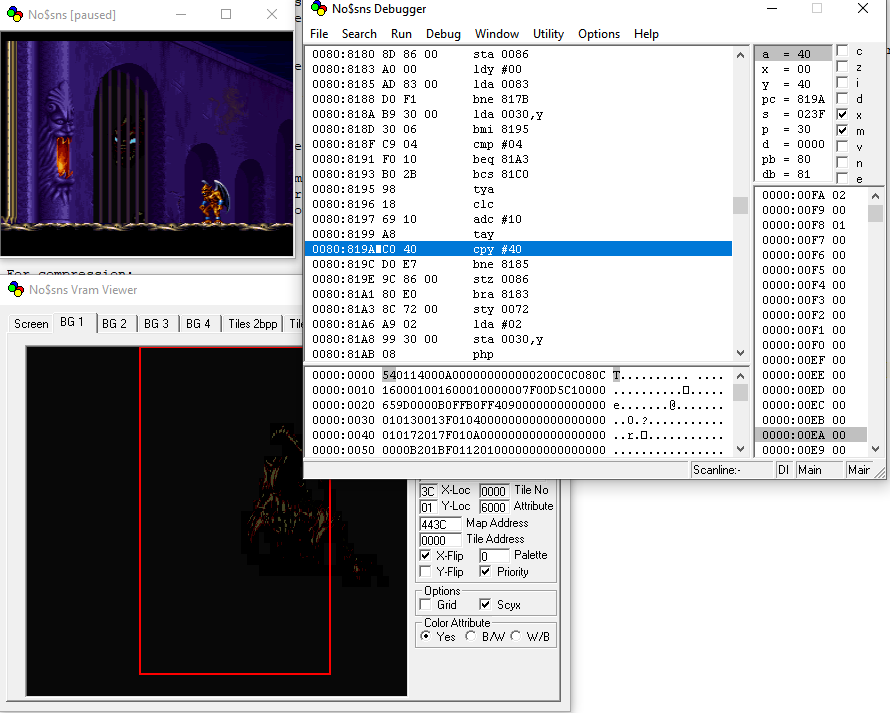
There's a window. In the window, the local disassembly appears in a listing, with the current instruction highlighted in blue. The local disassembly shows instructions laid out in one contiguous block of memory.
Or, here's another debugger, bsnes:
Another example of source-style debugging. The disassembly listing is on the right, with the current instruction highlighted in blue. They go the extra mile and put dividing lines in at observed function boundaries. I don't think that can ever be 100% robust but it's nice regardless.
Or, here's Visual Studio 2019:
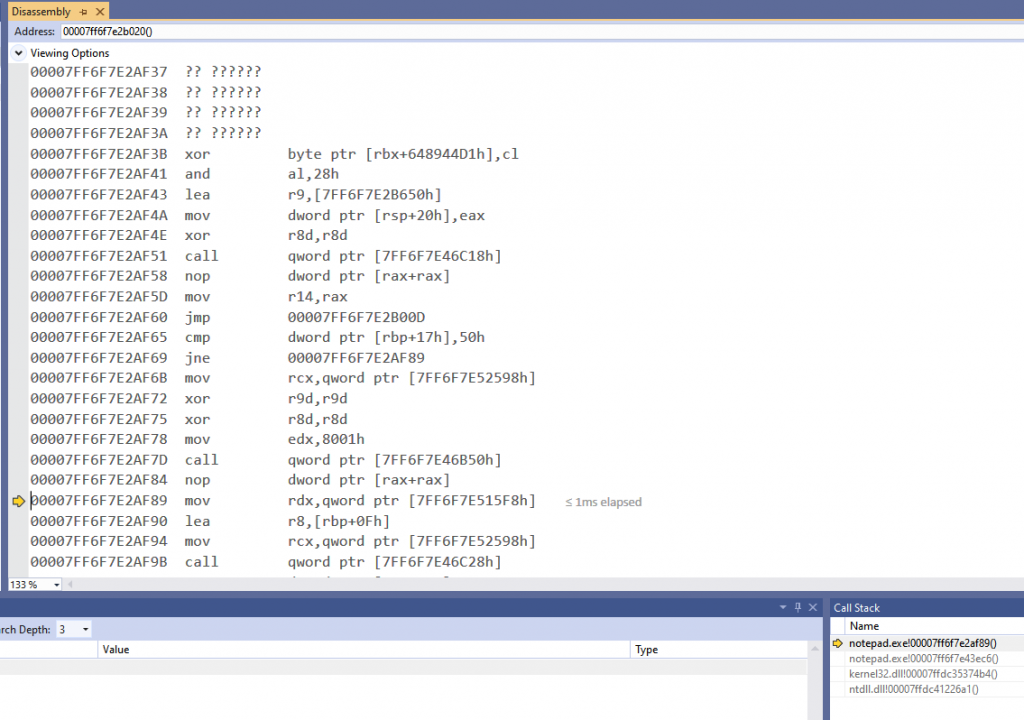
The instructions are listed out. The current instruction is highlighted with a yellow arrow to the left of it. There's some things that couldn't be disassembled so there's a placeholder with question marks.
These are all examples of source-style debugging. It's very popular.
Depending on the implementation, the listing in a source-style debugger can either be
- a local disassembly where all surrounding memory gets interpreted as code, whether it actually is code or not, or
- the result of a tracing, where only executed instructions appear in the listing, creating gaps
The former is a lot more common, as in all the above examples, although I've seen both.
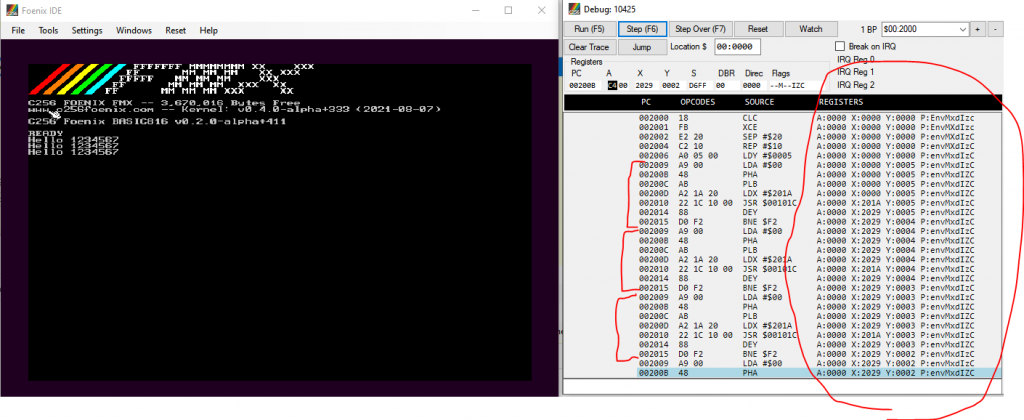
By contrast, a transcript style debugger will look like this:
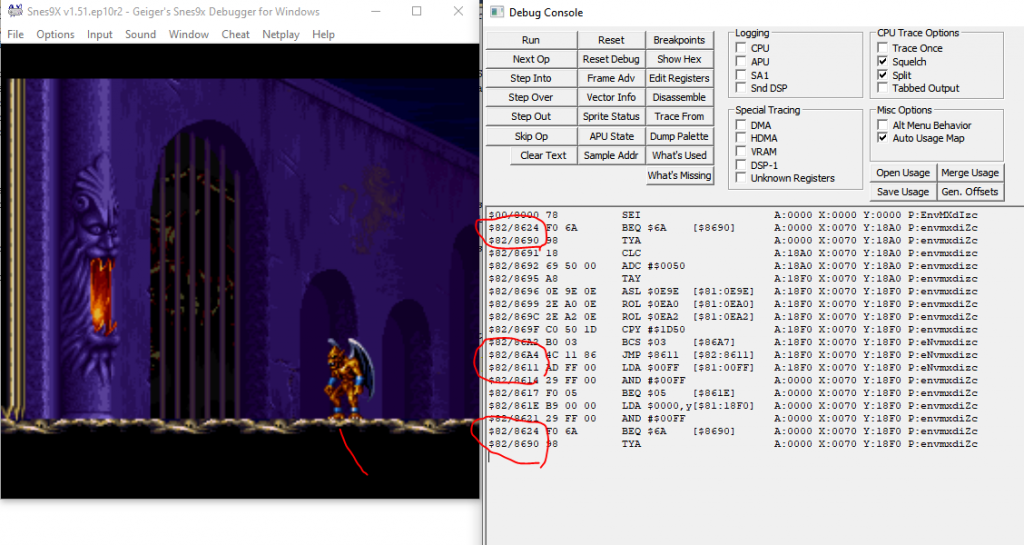
See, there are disjoint instructions, with those pairs circled in red.
Some instructions are listed more than once.
And register state is shown on each line. This platform doesn't have a ton of register space so that's honestly pretty manageable.
The transcript shows all branches with the branch taken, all registers with state at the time, all opcodes with their resolved argument, all loops are unrolled.
The kicker is that implementation of this debugger is dead simple and actually very dumb. It echoes each executed instruction to the output, along with the current register state. That's it.
Yet it is powerful and offers some advantages.
Advantage: history of register values
It's true pretty much all debuggers will show you register values, or variable/memory values at the current instruction. But what about 5 or 10 instructions ago?
You need to either have time-travel debugging, log it, or restart your program.
Some debuggers will cache the "last seen" way something executed (pointer argument, etc), and update it when that instruction is executed again. Great, you can see what was the last way something executed.
But what about the time before that? Or earlier? You can't easily put together a history of what happened unless you log these data points manually yourself.
For reverse-engineering object code with no source code, getting this history is really important in figuring out what happened. You might need to look for trends, look for a pattern, to get a sense of the higher level algorithm. Or you might want transcripts even with code you are familiar with, to get something like a time-travel trace on platforms where actual time-travel isn't available. There's strictly more information in the transcript than in the source-style listing.
"But, it's only outputting registers each line, not all of memory each line". That's true. Each line of the transcript is not a complete state of the machine. I think register state is the right tradeoff to suit most tasks. The exact choice will depend on the platform and the situation. If you're blessed with extensible transcript debugging, that'd probably be the best thing, so you could have like a "watch window" for each line. Generally for SNES, A/X/Y/P is perfectly fine.
Advantage: history of flow control
You can see a clear history of flow control. After all, that's useful. With a couple source-style debuggers, I've seen them do crazy things like try and draw a cute arrow denoting a function was stepped into.
With a transcript, you can see a history of how many times a loop ran, what index of a jump table was used, and which branches had the branch taken. If you save longer transcripts (e.g., with Geiger's SNES debugger's CPU log feature) you can also meaningfully diff transcripts with any text diffing tool of your choice to find divergent control flow like this.
With source-style debugging, you have no record-keeping of this unless you log it yourself, and you can easily miss what you're looking for.
Advantage: An edge case
This is a bad scenario and not something I've ever seen happen out in the wild.
But you could have it where the same memory is executed twice with the code interpreted in different ways, e.g., 8 bit versus 16 bit native mode.
I don't think a source style debugger could easily make sense of this. A transcript would show what happened clearly.
I made a proof of concept that does this and on testing it doesn't work well at all in a source-style debugger.
Advantage: Don't disassemble stuff that's not code
This is a big one, SNES games will often litter non-code throughout code.
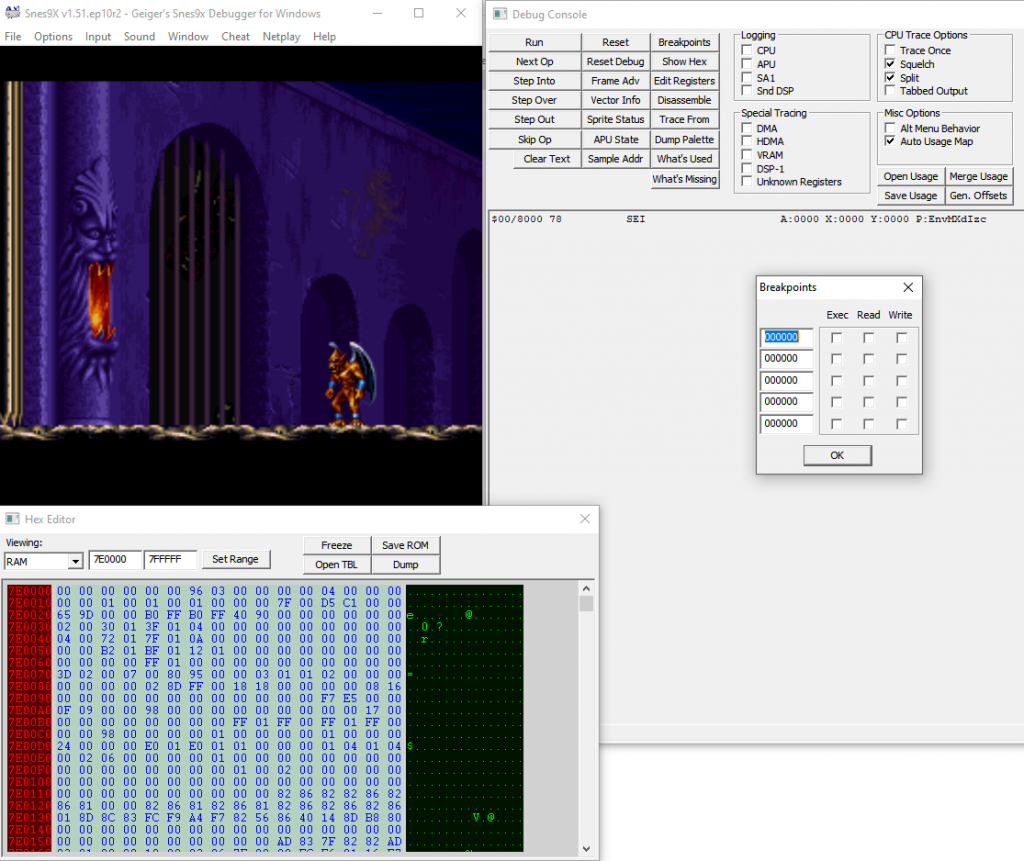
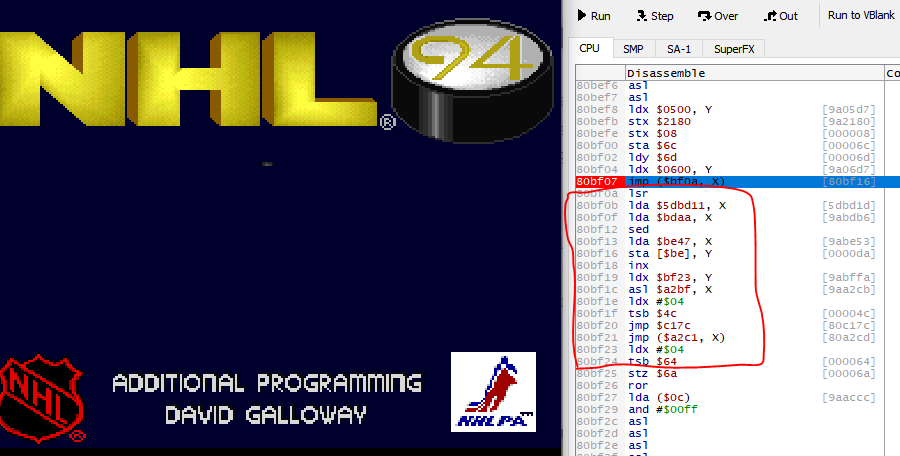
For example of what I mean, this is bsnes broken in NHL '94's graphics decompression
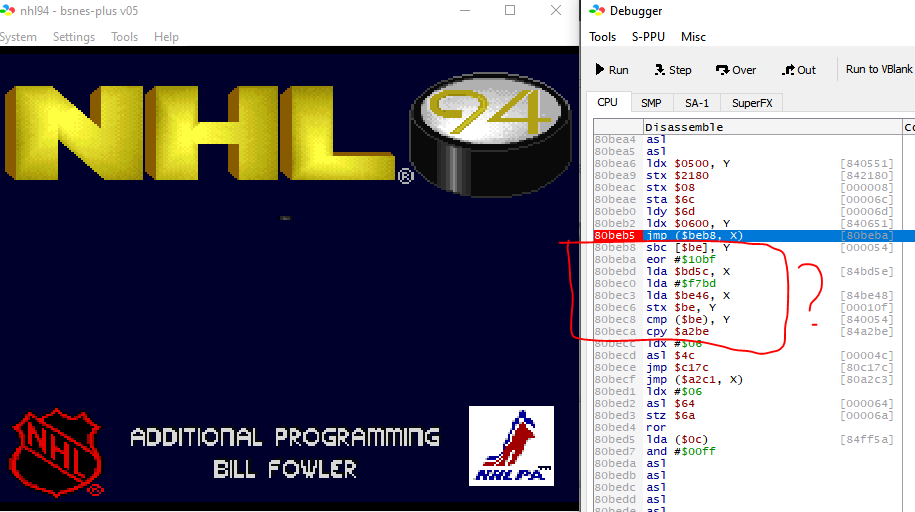
See the part outlined in red. Although there's no obviously illegal instructions, it looks suspicious. Why the CPY with such an arbitrary magic number address? Same with the EOR and the literal, what's up with that? Why the LDAs that immediately get overwritten?
The answer is this isn't code at all. It's data. This source-style debugger will disassemble everything in the neighborhood. That works great only so long as it actually is code. You hope it looks like obvious garbage code, so you can quickly spot it.
In this case, it's actually an array of short pointer offsets baked into the middle of object code. Those are supposed to be offsets, not instructions. If you're really observant you'll see that the preceding JMP $BEB8, X indexes into it and jumps based on an element. It's a hassle to spot this right away, and the debugger isn't doing anything to help you.
Here's another example in a different place
Again red outlined part is not actually code, it's data. This one's sneakier than the above because from a glance it looks less garbage compared to the last one. The big giveaway is SED which is not commonly used.
With transcripts, we don't have this problem. These garbage instructions aren't something you have to discern from non-garbage. Why? Because they don't get executed. They don't even appear.
Why is there data beside the code?
SNES is a different kind of execution environment from what some people are used to.
For the situation above, you might have the reaction "But I work in x86 a lot and I've never seen this before."
Well, x86-64 applications won't have data sprinkled in the code.
Why? Because Intel's architecture does really aggressive instruction prefetching, and the CPU has to know what's code versus what's data for that to work.
You can hear it from Intel themselves:
If (hopefully read-only) data must occur on the same page as code, avoid placing it immediately after an indirect jump. For example, follow an indirect jump with its mostly likely target, and place the data after an unconditional branch.
[...]
Always put code and data on separate pages.
Source: Intel's Optimization Guide
If you write source code that is compiled, the compiler will put object code in the .text segment and constant data in the .rodata segment- it'll do that for you.
Or if you write source code in x86 assembly language, you'd would use a directive like .CODE or .DATA to explicitly define what goes where.
The WDC 65xx-based CPU, on the other hand, is out there living its best life. Memory is just memory, doesn't matter what's where.
Since it doesn't matter at all, it's up to developer preference and convenience. In practice I do notice developers for 65xx platform dump data in the middle of their code like all the time. They'll bake data local in the same bank to take advantage of direct addressing, since if you put all data together it'd have to go in a different bank to fit. Or they're trying to save a MMU page change on certain computers where that matters (e.g., Foenix F256). Or they'll use a self-modified jump instruction instead of a jump table.
So if you work mostly in x86-64 or any other compiler toolchain with the same recommendation, that's one more reason why you probably go through life dealing with source style debuggers. No surprise data tripping you up. It's probably not something you ever think about.
With reverse-engineering on a platform like SNES the value of transcripts is more clear.
Recommendation
Geiger's SNES debugger is a transcript-style debugger, and you should consider it or something similar if you are debugging SNES without source code.
I also think transcript-style debugging is something we as an industry should consider more for debugging object code without source code. The benefit of source-style assembly debugging really only shines when you have symbolic debugging, or corresponding source code.
Using transcripts liberates you where you're not burdened with mapping control flows back to source code, there is only a series of behaviors. You could map them back to code, eventually. It's just not where you start.
Practical justification: I used transcripts to get these done
- Ripping all maps of Lagoon
- Enlarging the hitboxes in Lagoon
- Making an NHL '94 player name, profile and stats editor
- Making an NHL '94 player graphics decompression tool that's 100% accurate to the game's
- Fixed a bug in Lord of the Rings
- Disabling collisions in Lord of the Rings
- Make plants in Harvest Moon be automatically watered
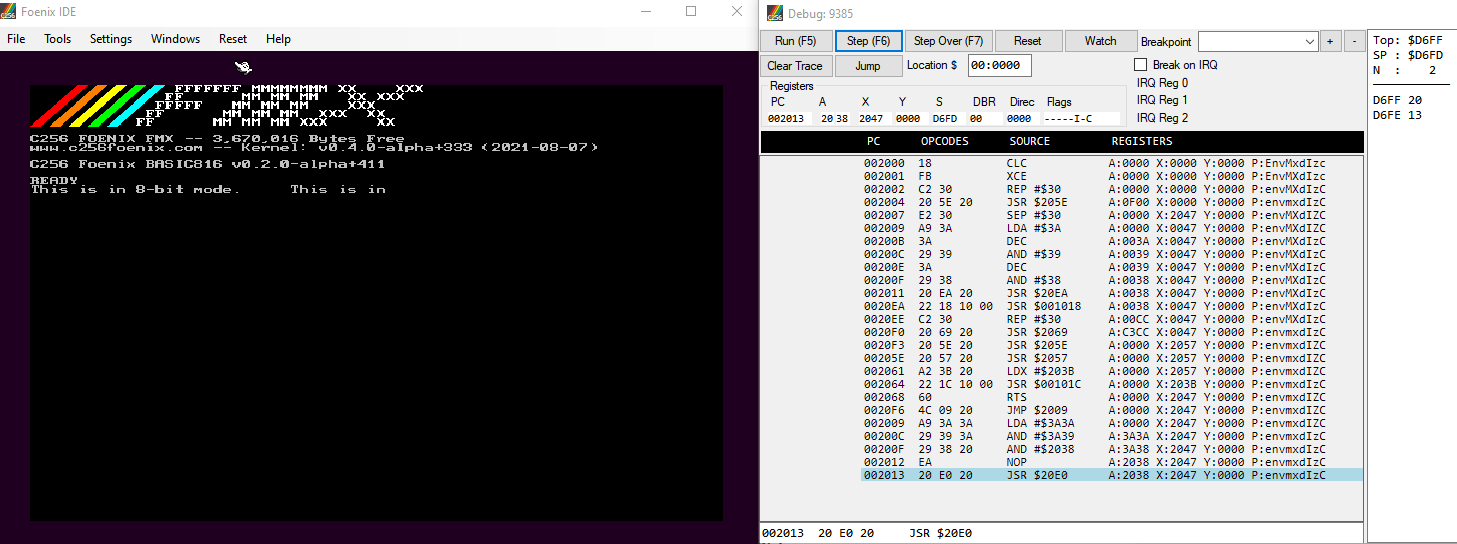
Bonus: Adding transcripts to C256 Foenix IDE debugger
C256 Foenix is a modern WDC 65816-based computer with an emulator.
For personal convenience I added transcript-style debugging to it, looks like this:
See there's duplicated instructions for a loop, and register output. With source-style, the listing looks like this, which provides a lot less information:
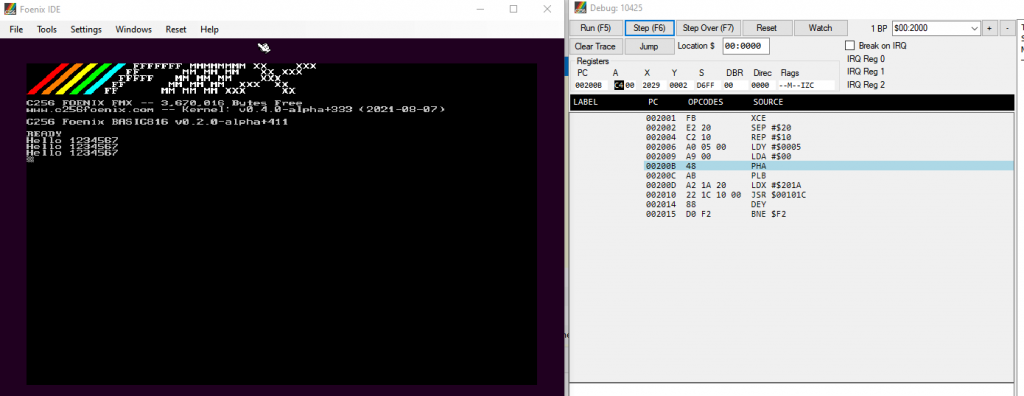
This transcript support is kept side-by-side with the default source-style debugger so that you can switch between them.
Enable it by going to "Settings" and checking the box for "Transcript-style debugger". When the box isn't checked, you get the default source-style debugger. The checkbox setting is remembered like the other settings so you don't need to check it every time.
I've already got some good use out of it. If you want to try it out, it's pushed to this private fork:
https://github.com/clandrew/FoenixIDE/tree/transcript
I did ask the developer of the emulator if he wanted to take a change like this to main. He said no. Not because he wouldn't take changes to the assembly listing format, but because he didn't see the value of transcript debugging.
With some gamer friend circles I'm constantly in this double bind wrt how I talk about VR.
If I don't invest in it I'm out of touch with real gaming scenarios, too 'casual' to acknowledge high-end configs, pandering to the lowest common hardware denominator, no optimism or imagination for what high-end PC gaming looks like in the future.
If I do invest in it I'm frivolous, all about motion controls, all about Wiimotes, EyeToy and XBOX Kinect, out of touch with traditional gaming, rejecting of keyboard and mouse gaming as stodgy, trying to replace everyone's CoD with Dance Central.
I have to fight so hard for any kind of middle ground, or nuanced position, in ways that I haven't had to for LDA or 3D stereo. Where I believe in the technology, I buy products of the technology, at the same time I don't expect a future where it's as ubiquitous as the internet browser and that's OK. I love VR and there's a place for VR to live alongside traditional setups. The huge checks being written today around metaverse-type products consumed in VR are feeding into this and creating polarization, it stresses me out a lot sometimes.
Recently someone asked me 'what are HLSL register spaces'? in the context of D3D12. I'm crossposting the answer here in case you also want to know.
A good comparison is C++ namespaces. Obviously, in C++, you can put everything in the default (global) namespace if you want, but having a namespace gives you a different dimension in naming things. You can have two symbols with the same name, and there's some extra syntax you use to help the compiler dis-ambiguate.
HLSL register spaces are like that. Ordinarily, defining two variables to the same register like this:
cbuffer MyVar : register(b0)
{
	matrix projection;
};

cbuffer MyVar2 : register(b0)
{
	matrix projection2;
};
will produce a compiler error, like
1>FXC : error : resource MyVar at register 0 overlaps with resource MyVar2 at register 0, space 0But if you put them in different register spaces, like this:
cbuffer MyVar : register(b0, space0)
{
	matrix projection;
};

cbuffer MyVar2 : register(b0, space1)
{
	matrix projection2;
};
then it’s fine, it's not a conflict anymore.
When you create a binding that goes with the shader register, that’s when you can dis-ambiguate which one you mean:
              CD3DX12_DESCRIPTOR_RANGE range;
              CD3DX12_ROOT_PARAMETER parameter;

              UINT myRegisterSpace = 1;
              range.Init(D3D12_DESCRIPTOR_RANGE_TYPE_CBV, 1, 0, myRegisterSpace);
              parameter.InitAsDescriptorTable(1, &range, D3D12_SHADER_VISIBILITY_VERTEX);
Q: In the above example, what if I defined both MyVar and MyVar2 as b0, then assigned bindings to both of them (e.g., with SetGraphicsRootDescriptorTable)?
A: That's fine. Just make sure the root parameter is set up to use the register space you intended on.
Small, simple test applications all written by one person usually don’t have a problem with overlapping shader registers.
But things get more complicated when you have different software modules working together. You might have some other component you don’t own, which has its own shaders, and those shaders want to bind variables which occupy shader registers t0-t3. And then there’s a different component you don’t own, which also want t0-t3. Ordinarily, that’d be a conflict you can’t resolve. With register spaces, each component can use a different register space (still a change to their shader code, but a way simpler one) and then there’s no conflict. When you go to create bindings for those shader variables, you just specify which register space you mean.
Another case where register spaces can come in handy is if your application is taking advantage of bindless shader semantics. One way of doing that is: in your HLSL you declare a gigantic resource array. It could be unbounded, or have a very large size. Then at execution time, you populate and use bindings at various indices in the array. Ordinarily, two giant resource arrays would likely overlap each other and create a collision. With register spaces, there's no collision.
Going forward, you might be less inclined to need register spaces with bindless semantics. Why? Because with Shader Model 6.6 dynamic resource indexing, bindless semantics is a lot more convenient- you don't have to declare a giant array. Read more about dynamic resource indexing here: https://microsoft.github.io/DirectX-Specs/d3d/HLSL_SM_6_6_DynamicResources.html
Finally, register spaces can make it easier to port code using previous versions of the Direct3D programming API (e.g., Direct3D 11). In previous versions, applications could use the same shader register to mean different things for different pipeline stages, for example, VS versus PS. In Direct3D 12, a root signature unifies all graphics pipeline bindings and is common to all stages. When porting shader code, therefore, you might choose to use one register space per shader stage, to keep everything correct and non-ambiguous.
If you want some more reference material on register spaces, here's the section of the public spec:
https://microsoft.github.io/DirectX-Specs/d3d/ResourceBinding.html#note-about-register-space
Short version: To disable collisions e.g., walk through walls in J. R. R. Tolkien's Lord of the Rings for SNES, use the following Pro Action Replay codes
80E0C780 (Disable horizontal collisions)
80E13480 (Disable vertical collisions)
Longer explanation below.
There are some areas in maps I wanted to look at in this game, and those areas are inaccessible playing the game normally. How can you look at inaccessible parts of the game?
One option: rip the map. That would work, although it's very hard. It would cascade into the problem of also ripping the tileset graphics and figuring out how the each map datum maps to which tile. I did this process once for a different game, Lagoon. Those maps are here. It was doable because I already did some other projects involving that game so I had some information about it. For games I'm less familiar with, like LotR, it will take longer, probably so long it's not worth it.
An easier option instead is to disable collisions. So I set out to do that.
The general sense I had was that this will be a code change to the collision logic in the game. Some code must take the player's position, do some comparisons on it, and permit you to move or not move based on the comparisons. But which code is doing this?
1. Where position is stored
Breaking the problem down, the first step is to find where your position is stored in memory. It's likely to be an X, Y position since what kind of a maniac would store it in polar.
So there's a number, somewhere in the program. Classic problem where we don't know where it is stored. But worse yet, we also don't know what the number is, what its value is.
When faced with this kind of problem I do something I'm calling "special diffing", you can call it whatever you want, basically you take 3 or more memory dumps.
- For dump 0, you've got your character somewhere.
- For dump 1, you move them a little bit to the right.
- For dump 2, you move them a little bit more to the right.
And then write some code that opens the dumps, looking through each offset for some number that's increasing from dump 0 to 1, and 1 to 2. Want more confidence? Take more memory dumps to have more data points.
Why move horizontal and not vertical? Because there isn't a strong convention in computer graphics about whether up is positive or not. For horizontal there's a pretty strong convention.
Why move to the right, and not left? Convenience, we probably expect the position value to increase going to the right.
Why move just a little, and not a lot? So that you don't overflow the byte type (e.g., exceed 255) since that's a hassle to account for.
Using this diffing technique gave a few answers
- 7E05D3
- 7E0AE7
- 7E0EF7
- 7E1087
- 7E128F <-- The answer
- 7EFD46
It was a low enough number to rule out the false positives and find the answer:
7E128FThe other values corresponded to position too, but they were an output of it not an input. E.g., changing the value wouldn't stick, except for 7E128F.
2. What position is used for
The next obvious step is to break-on-write of position. We expect it to get hit whenever your character walks around, since it would get updated then. And moreover, we'd expect that code path to not get taken if you're hitting a wall.
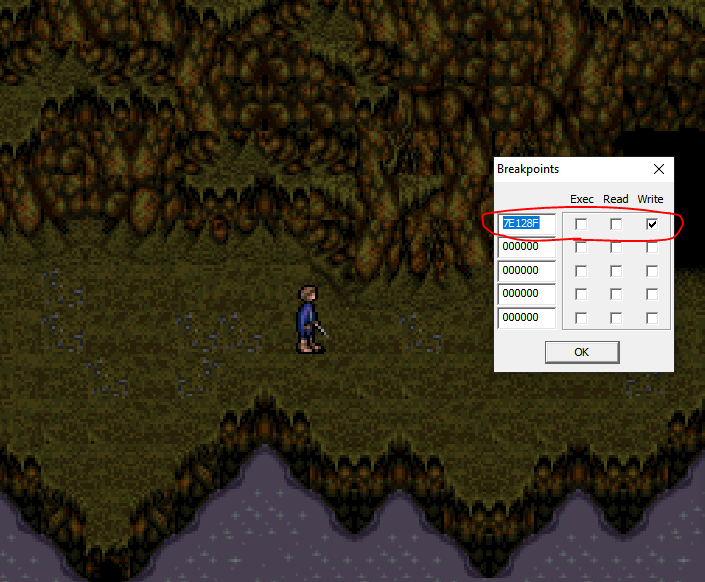
Bad news here. The break-on-write will always fire regardless of whether you're moving or not-- the code is set up to always overwrite your position even if it doesn't need to. So that kind of breakpoint won't directly tell us which code paths fire or don't fire based on your hitting a wall.
For the record, it hits here:
$80/C88E 99 8F 12 STA $128F,y[$80:128F] A:0100 X:0000 Y:0000 P:envmxdizcThat's okay. It will at least tell us something, when your position does get updated while moving, and we can still reason about what happens when it doesn't get updated.
And in particular, we can locally disassemble or CPU log to find the preceding operations
...

$80/C883 69 00 00    ADC #$0000              A:0000 X:0000 Y:0000 P:envmxdiZc
$80/C886 99 97 14    STA $1497,y[$80:1497]   A:0000 X:0000 Y:0000 P:envmxdiZc
$80/C889 AA          TAX                     A:0000 X:0000 Y:0000 P:envmxdiZc
$80/C88A 18          CLC                     A:0000 X:0000 Y:0000 P:envmxdiZc
$80/C88B 79 8F 12    ADC $128F,y[$80:128F]   A:0000 X:0000 Y:0000 P:envmxdiZc
$80/C88E 99 8F 12    STA $128F,y[$80:128F]   A:013A X:0000 Y:0000 P:envmxdizc
So some position-increment value gets saved to $80:1497, then increment the position by that number too. We can use this to work backwards and see a bunch of other fields updated as well.
Now we know the neighborhood of the collision code and can reason about the code path involved.
3. Finding the branch
There are a couple ways to proceed from here. There's a 'nice' option and a 'cheesy' option.
The 'nice' option is to take where we know the position is stored, and find the chain of operations done to its value. This works out if the control flow for controlling position is pretty localized-- say, if collision-checking and position-updating is all in one tidy function and they're right next to each other.
Unfortunately, the position-updating logic was messy. It was seemingly tangled up with the logic for checking for interact-ables (e.g., doors, NPCs). So while the 'nice' option is still an option, it's costly. Therefore there's the 'cheesy' option.
The cheesy option is to break on position change, using the information we found above, so we at least have some kind of frame delimiter and something to look for. Then enable CPU logging. Log:
- one 'frame' where you can move, and
- one 'frame' where you're obstructed.
Then strip out IRQs (they create noise), and put the result through a giant diff. I used Meld.
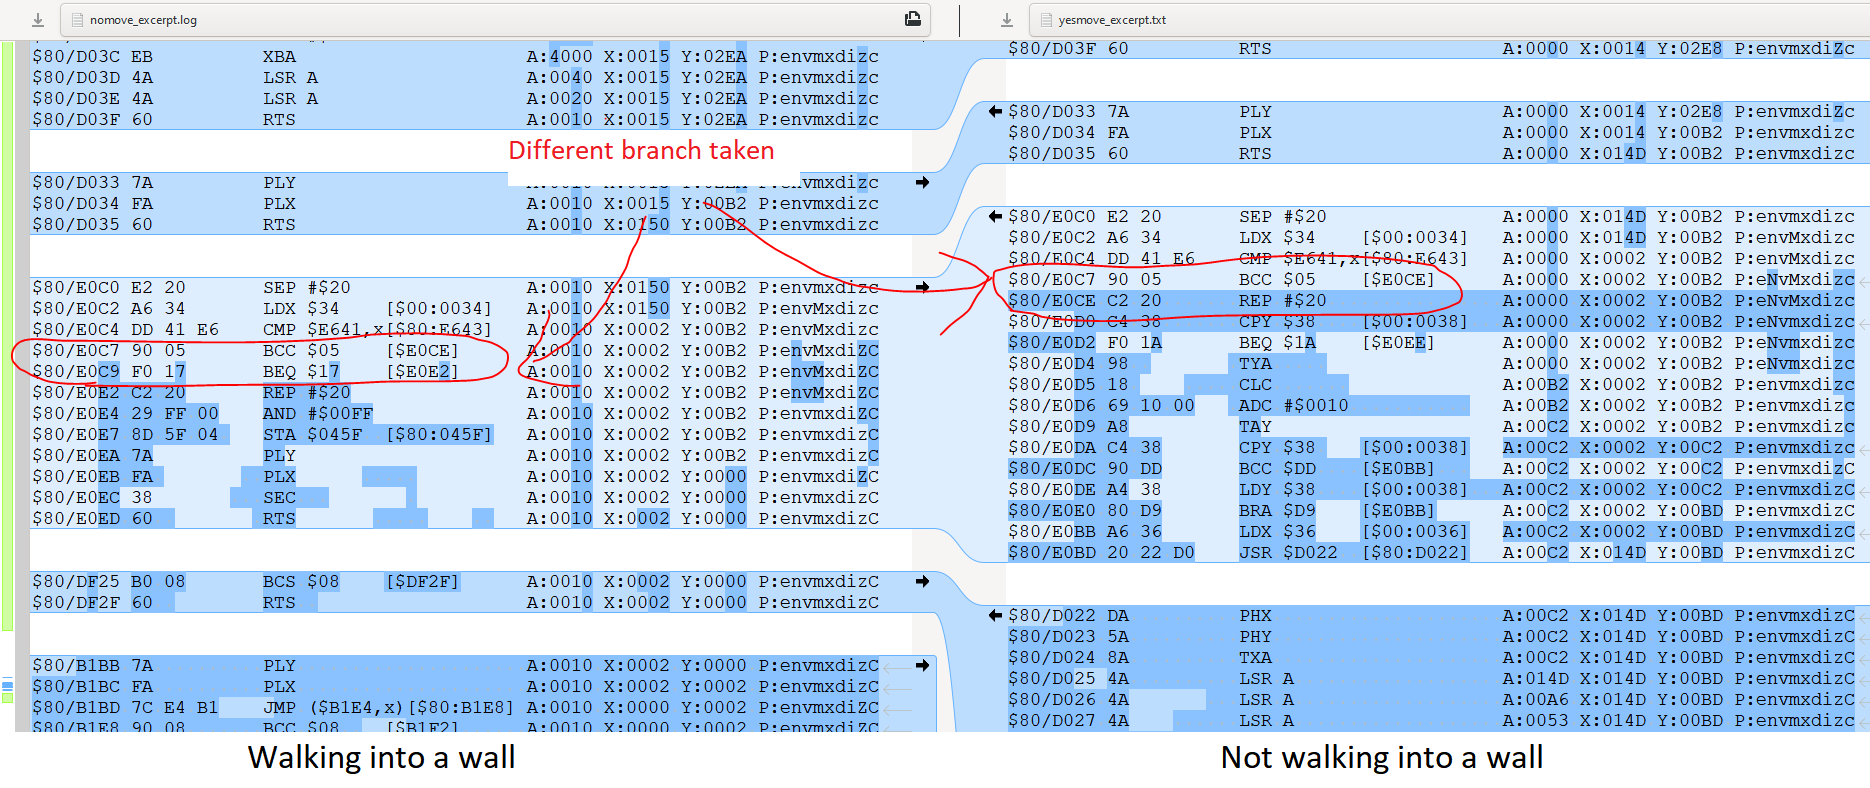
The diff isn't so crazy.
See there's data-divergence up until a certain point. After that, execution-divergence. It was a kind of thing where I scrolled through it and it caught my attention, so not a really thorough debugging experience, anyway the previous stuff to untangle where position is stored helped to understand the data-divergence and filter out noise in the diff.
And that ended up being the answer. The comparison
$80/E0C4 DD 41 E6    CMP $E641,x[$80:E643]   A:0010 X:0002 Y:00B2 P:envMxdizc
$80/E0C7 90 05       BCC $05    [$E0CE]      A:0010 X:0002 Y:00B2 P:envMxdiZC
will check if you're about to collide with a wall, or not. If you're free to move, you take the branch. If you're obstructed, you fall through. Therefore we can disable collisions by always taking the branch. So change
$80/E0C7 90 05 BCC $05 [$E0CE]to
$80/E0C7 80 05 BRA $05 [$E0CE]A quick test will show you this only covers horizontal collisions. Vertical goes down a completely separate code path. I guessed that they shared a common subroutine
$80/E0BD 20 22 D0 JSR $D022 [$80:D022] A:00B2 X:0150 Y:00B2 P:envmxdizCand this ended up being true. Setting a breakpoint on D022 ended up hitting for the vertical case:
$80/D022 DA          PHX                     A:0E05 X:016B Y:0095 P:envmxdizc
$80/D023 5A          PHY                     A:0E05 X:016B Y:0095 P:envmxdizc
$80/D024 8A          TXA                     A:0E05 X:016B Y:0095 P:envmxdizc
$80/D025 4A          LSR A                   A:016B X:016B Y:0095 P:envmxdizc
$80/D026 4A          LSR A                   A:00B5 X:016B Y:0095
...
$80/D033 7A          PLY                     A:0000 X:0016 Y:026C P:envmxdiZc
$80/D034 FA          PLX                     A:0000 X:0016 Y:0095 P:envmxdizc
$80/D035 60          RTS                     A:0000 X:016B Y:0095 P:envmxdizc
$80/E12D E2 20       SEP #$20                A:0000 X:016B Y:0095 P:envmxdizc
at which point it's easy to step out 1 frame and see the caller. And it turns out the caller looks very similar to the horizontal case, with the same kind of branch. It has
$80/E131 D9 41 E6    CMP $E641,y[$80:E643]   A:0000 X:003F Y:0002 P:envMxdizc
$80/E134 90 05       BCC $05    [$E13B]      A:0000 X:003F Y:0002 P:eNvMxdizc
So you can do a similar thing, changing the branch on carry clear to a branch unconditional
$80/E134 80 05 BRA $05 [$E13B] Putting it all together, the two codes are
80E0C780 (Disable horizontal collisions)
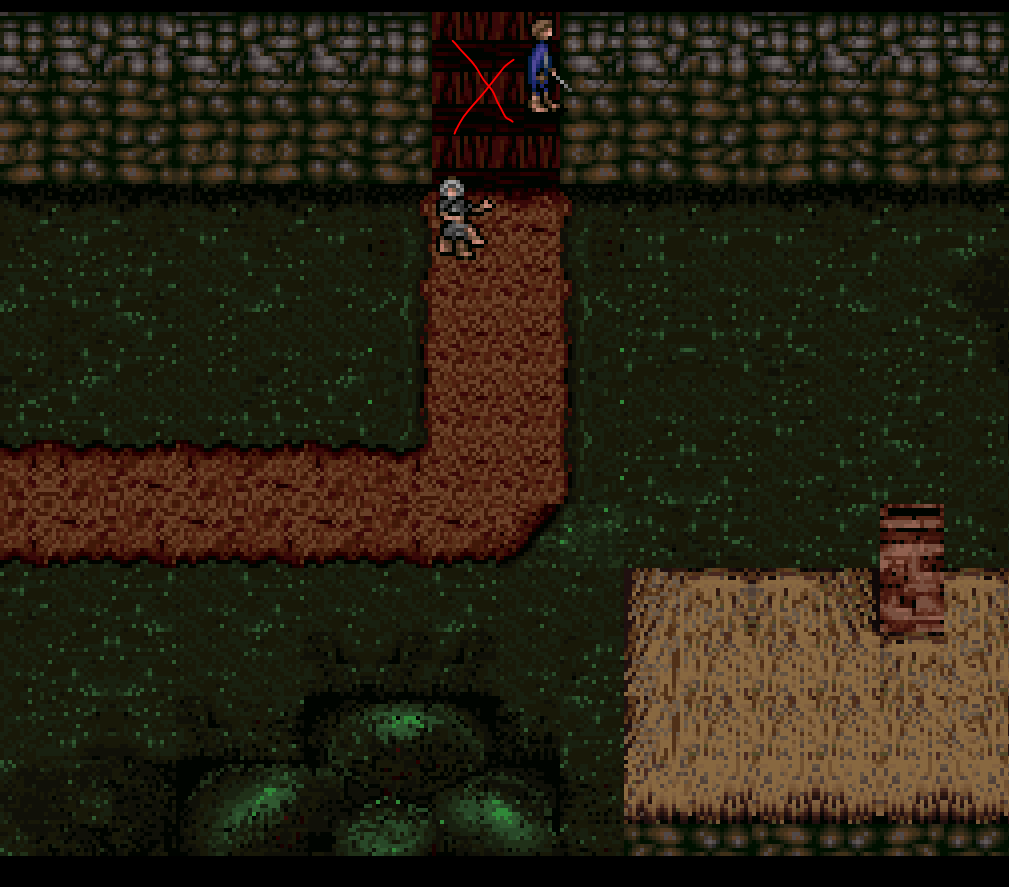
80E13480 (Disable vertical collisions)Here's a demo of it in action, successfully getting past a door.
Side thing, I also used the code to get above the door in Bree. That said, even when enabling collisions again, it didn't take me anywhere. So the door's either controlled by non-'physical' means or not implemented.
I was still left with this question of whether we can conclusively say the door is not implemented.
It's one thing to prove a positive, prove a program does something. Easy enough, you show it doing the thing.
It's another thing to prove a negative, to prove a computer program will never do a thing. Can you prove the door can never open? Not ever? You can't really, you can only reach levels of confidence. Can you prove White Hand is not in Pokemon? Can you prove Herobrine is not in Minecraft? Has anyone ever conclusively proven that the pendant in Dark Souls doesn't do anything? Well, see, they ran the program through a simulator and-- just kidding, they went low tech and asked the director, so then it's a social engineering problem of whether you believe him.
When people use formal or other methods to prove program behaviors or nonbehaviors, they exploit constraints in the programming language or execution environment. For example, a language like Haskell has a rich set of constraints which are helpful in proving behavior. Or if a computer is unplugged and has no battery, you have confidence it won't power on. But in our case we're talking about object code, not source code, and we're talking about something the hardware could do. The instruction set of the object code alone doesn't provide helpful constraints. Hell, we can't even universally statically disassemble programs on this platform (because the choice of instruction width is dynamically chosen). Statically prove nonbehavior?
I'm not trying to give credibility to conspiracy theories or the mindset behind that kind of thinking. I'm trying to explain why you might not find a conclusive answer when you might want one. Anyway, through this exercise I got a greater level of confidence that the door doesn't go anywhere.
Some details
- You can use both codes or one at a time.
- Disabling collisions means you also can't interact with objects like doors. If you want to pass through doors, re-enable collisions or enable them for one direction.
- If collisions are disabled for you, they're also disabled for allies, NPCs, and enemies.
- Disabling collisions will let you pass through 'physical' doors in the game, where you're obstructed simply by where you're allowed to walk. For example, the gate in Moria, and the fires on the steps by the Balrog. There can be other 'non-physical' doors, where you need to trigger the right game event (e.g., have a key) to open them.
I used password tricks to get to the end area with all events signaled in any case, and had collisions off. I got to freely walk around the area where you find Galadriel with the mirror.
It turns out, the area is an infinite plane!
It's for the best not to try and rip the level data. /j
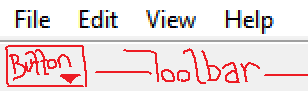
Say you're writing a Win32 application. You add a toolbar. Simple enough. Toolbar would look better with some things on it.
You want to, say, add a button to it. Like this
Flip through Petzold.
No chapters for toolbar dropdowns.
No obvious samples to use.
We're on our own, then.
Attempt 1: BTNS_DROPDOWN
You follow some of the sample code, and do the most natural thing. Use the toolbar button style 'BTNS_DROPDOWN'. (By the way, BTNS_DROPDOWN is the updated define for TBSTYLE_DROPDOWN. They mean the same thing.)
    TBBUTTON tbButtons[] =
    {
        { STD_CUT, 0, TBSTATE_ENABLED, BTNS_DROPDOWN, {0}, 0, (INT_PTR)L"Test" },
    };

    m_hwnd = CreateToolbarEx(
        parent,
        WS_CHILD | WS_VISIBLE | CCS_ADJUSTABLE | TBSTYLE_TOOLTIPS,
        0,
        sizeof(tbButtons) / sizeof(TBBUTTON), //nBitmaps
        HINST_COMMCTRL,
        0, // wBMID
        tbButtons, //lpButtons
        sizeof(tbButtons) / sizeof(TBBUTTON), // iNumButtons
        90, 90, 90, 90,
        sizeof(TBBUTTON)); // uStructSize

    SetWindowLongPtr(m_hwnd, GWLP_USERDATA, (LONG_PTR)this);
    SendMessage(m_hwnd, TB_AUTOSIZE, 0, 0);
    ShowWindow(m_hwnd, TRUE);
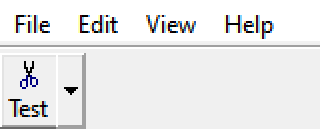
Compile and run. STD_CUT is your standard built-in Windows scissors 'cut' icon. Result looks like this:
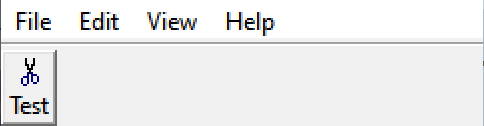
That visually looks fine. But wait. Let's try clicking on it.
It doesn't even show a 'button is pushed' animation. It should at least do that, right?
What gives? It's not disabled.
Attempt 2: TBSTYLE_EX_DRAWDDARROWS
Okay, so maybe our initialization of the dropdown menu was incomplete. Dropdown menus usually have an arrow at the right. Perhaps we need to add the "arrow at the right" extended style? Let's try adding the code
SendMessage(m_hwnd, TB_SETEXTENDEDSTYLE, 0, TBSTYLE_EX_DRAWDDARROWS);So that now, it looks like
    TBBUTTON tbButtons[] =
    {
        { STD_CUT, 0, TBSTATE_ENABLED, BTNS_DROPDOWN, {0}, 0, (INT_PTR)L"Test" },
    };

    m_hwnd = CreateToolbarEx(
        parent,
        WS_CHILD | WS_VISIBLE | CCS_ADJUSTABLE | TBSTYLE_TOOLTIPS,
        0,
        sizeof(tbButtons) / sizeof(TBBUTTON), //nBitmaps
        HINST_COMMCTRL,
        0, // wBMID
        tbButtons, //lpButtons
        sizeof(tbButtons) / sizeof(TBBUTTON), // iNumButtons
        90, 90, 90, 90,
        sizeof(TBBUTTON)); // uStructSize

    SendMessage(m_hwnd, TB_SETEXTENDEDSTYLE, 0, TBSTYLE_EX_DRAWDDARROWS);

    SetWindowLongPtr(m_hwnd, GWLP_USERDATA, (LONG_PTR)this);
    SendMessage(m_hwnd, TB_AUTOSIZE, 0, 0);
    ShowWindow(m_hwnd, TRUE);
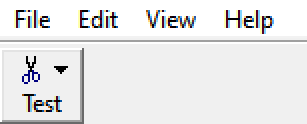
Let's compile and run it and see what it looks like now.
This looks better. There's an arrow on the right. That should mean something good. Let's try clicking on it.
Clicking on the button itself works.
Clicking on the arrow doesn't 🙁
Attempt 3: BTNS_WHOLEDROPDOWN
Maybe the ticket is WHOLEDROPDOWN. Looking it up in the header, BTNS_WHOLEDROPDOWN purports to

That sounds like it could make the whole button appear responsive, so why not let's try it.
Result looks like this:
Okay. What if we try to click on it?
Nothing happens 🙁
What to do?
The Answer
The answer: toolbar dropdown menus, by default, don't have any animation for clicking on them. They're not like normal buttons. That's right, the button is still working, there's just no visual feedback unless you explicitly attach some yourself.
To make the toolbar dropdown button do something, you have to just trust that it is set up ok, and attach some behavior to the dropdown notification.
Fortunately you don't have to re-invent the wheel to do that. Here's an easy way to attach a simple pop-up menu to the dropdown.
First, you need to have your WndProc pay attention to WM_NOTIFY. The handler can be something like
    case WM_NOTIFY:
    {
        LPNMTOOLBAR lpnmtb = (LPNMTOOLBAR)lParam;

        if (lpnmtb->hdr.code == TBN_DROPDOWN)
        {
            // Get the coordinates of the button.
            RECT rc;
            SendMessage(lpnmtb->hdr.hwndFrom, TB_GETRECT, (WPARAM)lpnmtb->iItem, (LPARAM)&rc);

            // Convert to screen coordinates.
            MapWindowPoints(lpnmtb->hdr.hwndFrom, HWND_DESKTOP, (LPPOINT)&rc, 2);

            HMENU hMenuLoaded = LoadMenu(g_hInst, MAKEINTRESOURCE(IDR_MENU1));

            // Get the submenu for the first menu item.
            HMENU hPopupMenu = GetSubMenu(hMenuLoaded, 0);

            TPMPARAMS tpm;
            tpm.cbSize = sizeof(TPMPARAMS);
            tpm.rcExclude = rc;

            TrackPopupMenuEx(hPopupMenu, TPM_LEFTALIGN | TPM_LEFTBUTTON | TPM_VERTICAL, rc.left, rc.bottom, hWnd, &tpm);

            DestroyMenu(hMenuLoaded);
        }
        break;
    }
As for the menu IDR_MENU1, you can point it to a menu you have defined. Or, if you want a placeholder thing, put something like this in your .rc file:
IDR_MENU1 MENU
BEGIN
    POPUP "TEST"
    BEGIN
        MENUITEM "Option 1",                        ID_TEST_OPTION1
        MENUITEM "Option 2",                        ID_TEST_OPTION2
    END
END
That goes along with these defines in the Resources.h coupled to the .rc file:
#define IDR_MENU1                       132
#define ID_TEST_OPTION1                 32777
#define ID_TEST_OPTION2                 32778
Build, and you get this:
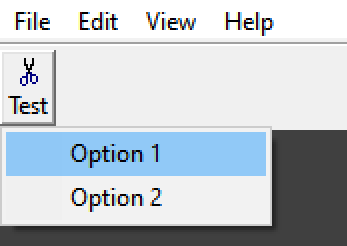
In animated form:
The dropdown works. Success!
It so happens if you re-try Attempt 2, TBSTYLE_EX_DRAWDDARROWS with a pop up menu, then it'll provide visual arrow-is-pressed feedback where it didn't before. See:
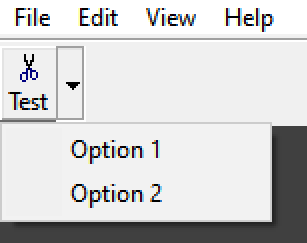
This is because BTNS_DROPDOWN, TBSTYLE_EX_DRAWDDARROWS, and BTNS_WHOLEDROPDOWN follow a common principle: anything that appeared unresponsive with no pop up menu attached is responsive once a menu is attached.
This system was not super well explained elsewhere, so maybe this will help you.
I made a Visual Studio extension for 65C816 syntax highlighting. Suitable for SNES or C256 Foenix projects. Looks like this:

The source+binary are on GitHub, here: https://github.com/clandrew/vscolorize65c816
I had some past experience working on a big existing system in a Visual Studio extension in a job I had a little while ago. This was my first time writing an extension for a recent version from scratch. The experience was different.
I accomplished what I set out to do and it's working well, but the path of getting there was cumbersome.
Here is a list of the problems I ran into.
Problem: No extension template.
Root cause: Template requires an optional add-on.
How debugged: search engine.
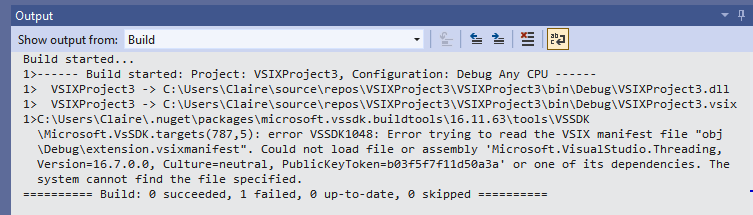
Problem: Official template has build error right out of the gate:
error VSSDK1048: Error trying to read the VSIX manifest file "obj\Debug\extension.vsixmanifest". Could not load file or assembly 'Microsoft.VisualStudio.Threading, Version=16.7.0.0, Culture=neutral, PublicKeyToken=b03f5f7f11d50a3a' or one of its dependencies. The system cannot find the file specified.
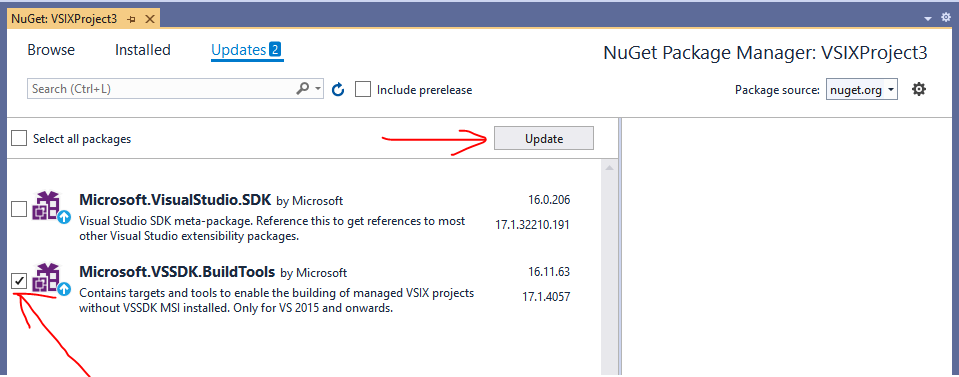
Root cause: The template has a missing dependency. To fix, you have to update the NuGet package "Microsoft.VSSDK.BuildTools".
How debugged: Shotgun debugging
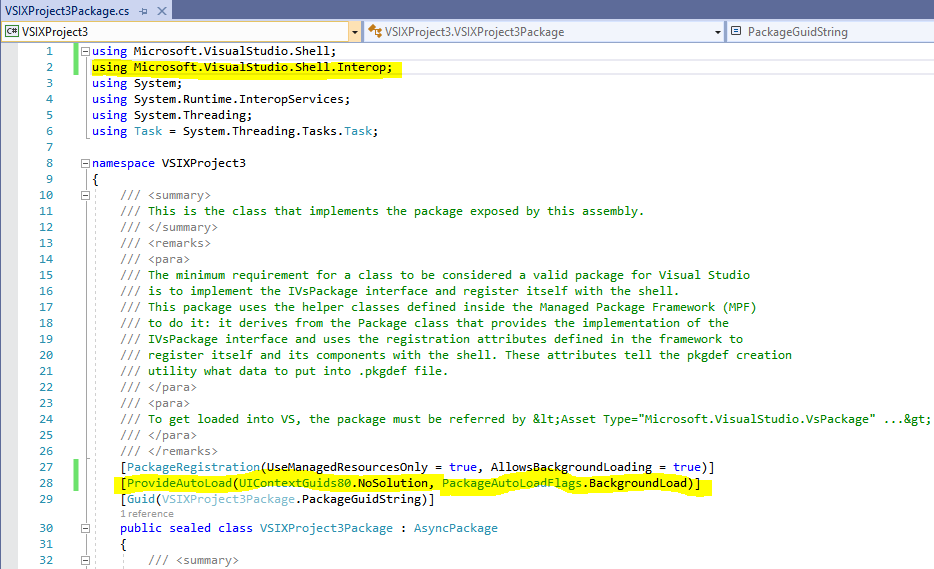
Problem: Template does not behave correctly out of the gate. When launched with debugger, it is never loaded
Root cause: The template is missing an attribute
How debugged: Search engine
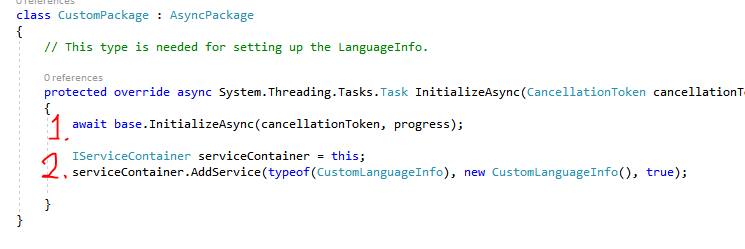
You don't create a syntax highlighter object out of the blue. You define a 'Package' object to set it up. I defined one in code.
Problem: Package object is never instantiated.
Root cause: You have to define, at a minimum, two attributes to make it get loaded: [PackageRegistration] and [ProvideAutoLoad].
How debugged: Looking at other extensions as examples + shotgun debugging
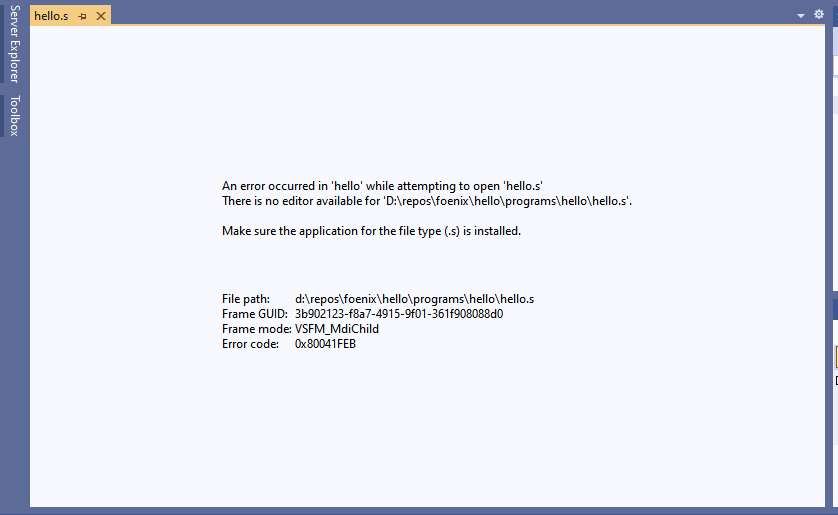
Problem: The package is instantiated, but doesn't correctly associate with the intended files. Error message when opening files that have ProvideLanguageExtension. "An error occured in 'file' when attempting to open 'file.s'. There is no editor available for 'file.s'. Make sure the application for the file type (.s) is installed."
Root cause: Something is stale. Reload the file! Even if you restart the whole IDE, it's not enough! It stays stale unless you specifically reload the file
How debugged: Shotgun debugging
Problem: The package adds a LanguageInfo service, but the LanguageInfo is never instantiated.
Root cause: You have to call AddService after InitializeAsync, not before
How debugged: Shotgun debugging + code examples
Problem: The syntax is not highlighted as intended
Root cause: Need to have IVsColorizer::ColorizeLine return the intended values
How debugged: Actual debugging
Problem: The choice of which attribute value maps to which color seems arbitrary
Root cause: There is a system of default colors. You can know that default through experimentation, or over-ride it in a specific way
How debugged: Experimentation
Takeaway- I accomplished what I was trying to do, but there was a lot of shotgun debugging and 'just trying things'. The extension framework has you hook into a complicated system which is also closed-off and opaque, so there is no way to directly debug it.
It may as well be running on a different computer.
By "system", I'm referring to
- The mechanism that instantiates your custom package and calls InitializeAsync on it
- The thing that looks at your custom package and loads it based on PackageRegistration
- The thing that sets up associations using package attributes like ProvideLanguageExtension.
- The thing that executes methods of objects set up with IServiceContainer::AddService
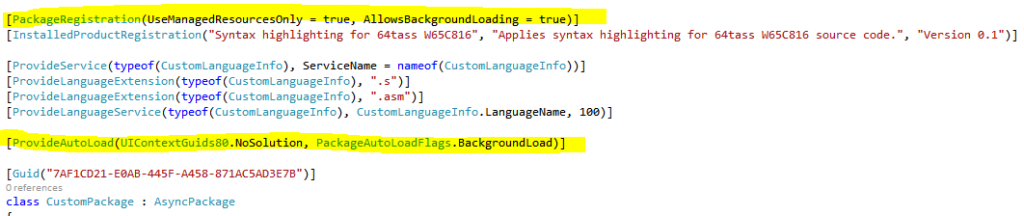
Look at my extension or other people's samples. You're supposed to define a **** ton of attributes on the Package class.
Here's an example from an open source project on GitHub:
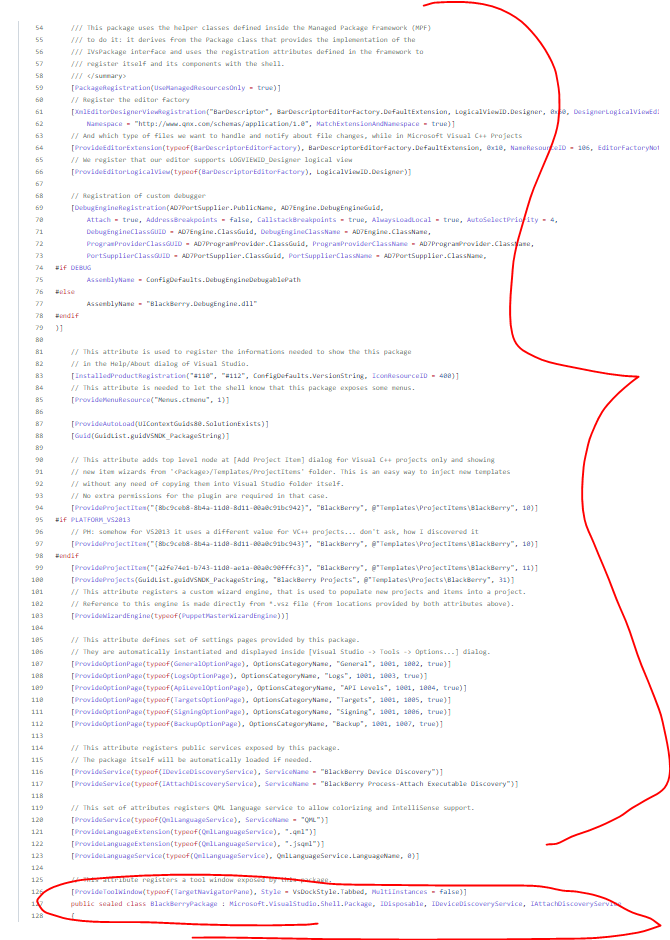
It's to the point where the attributes are really a language in and of themselves. Guess what, they feed into some complicated loader that executes before your code is ever executed. If there's a mistake in the attributes? Get your psychic powers ready. Because there's no insight into this closed system or way see what it's doing. It doesn't even have the decency to put its state to debug console.
The time I spent actually debugging problems was in the minority. Most problems, the only way to fix them was by trying things. It's really bad. They could not be debugged in the debugger because they occur in a complicated system you don't have access to. This system and its higher-level concepts were not documented well enough to automatically know what to type. "Is ProvideLanguageService not supposed to have languageResourceID 100? Is that the reason it's failing, or something else?"
I'm not even angry about the 17KB of code and god knows how much memory it takes to make text a different color according to a simple scheme. What's really bad is this this closed off system that everyone is supposed to just be okay with, since I see it as part of a trend. UI layouts from markup are like this. App store launching is like this. Software junk food "press F5"-style emulators and VMs are like this. As we get more and more complicated software systems, there isn't enough follow-through to make them fully open and debuggable. So if they 'just work the first time' fantastic. But we all live in reality. Things will go wrong, and when they do, it's clear the system is grand and complicated and undocumented and undiagnosable.
As a random example, can you imagine if Direct3D 12 had no debug layer, and all it told you was E_INVALIDARG? Why would we accept this more broadly?
This is why I keep writing GUI applications as executables with Win32 or Windows Forms say. The form designer has the decency to give you a call stack. Actionable stack or some error string should be the bare minimum.
Shifting topics, here are things I learned about Visual Studio custom colorizers:
- The 'state' values passed to/from your callbacks have whatever meaning you want them to. The meaning of states is all user-defined. It's opaque to Visual Studio.
- An IVsLanguageInfo is reponsible for providing two things: a colorizer, and a code window manager. But you don't need to have both. You can just provide one if you want. For example you can provide a colorizer, but return E_NOTIMPL to IVsLanguageInfo::GetCodeWindowManager.
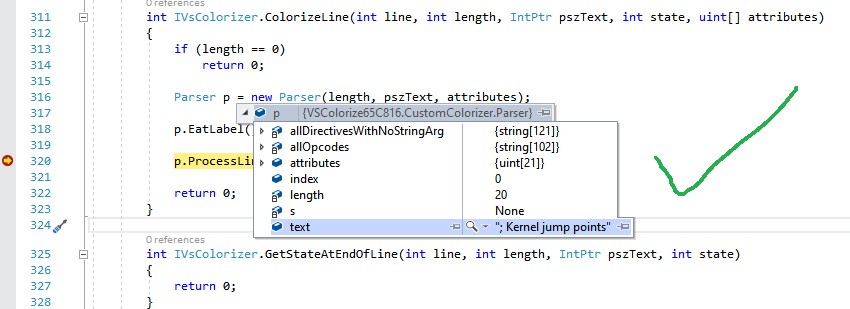
- In IVsColorizer::ColorizeLine, character at index N in the 'pszText' corresponds to element N of 'attributes' parameter.
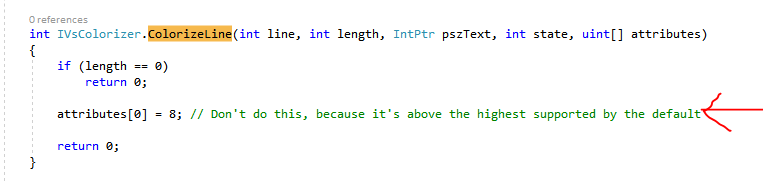
- To add colors to text, you set values in the 'attributes' parameter of IVsColorizer::ColorizeLine. Like this:
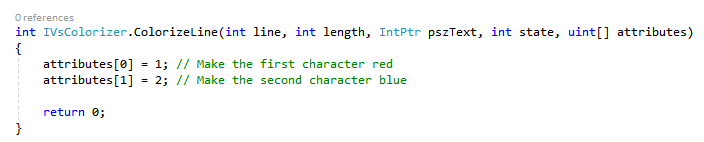
Why does 1 mean red? Because it's based on whatever you set in your IVsProvideColorableItems callback object.
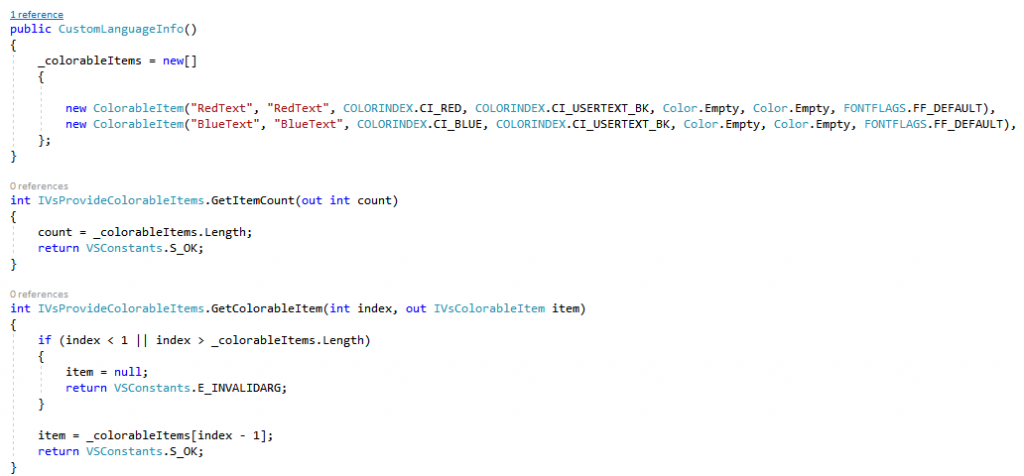
Yes, it's 1-indexed.
If you don't have an IVsProvideColorableItems set up, you'll get some defaults with blue, green, red, and black (default) text numbered in some way. You can experiment what means what. Using a value of greater than 6 will crash the extension, so that's fun. In my case, the default was almost good enough, but I wanted gray for directives like C++ has, for e.g., #include and #pragma. So I did end up implementing IVsProvideColorableItems.
All told, if you use the syntax highlighter with custom build tools, it looks like this:

so the experience is pretty smooth.
Direct download to the release is here https://github.com/clandrew/vscolorize65c816/releases/tag/v1.0.